Spatio-temporal
Dataset on City Community Structure in Middle Reaches of Yangtze River
(2000‒2014)
Gao, P.1 He, D.2* Ning, Y. M.3
1. Shanghai Institute for
Global City, Shanghai Normal University, Shanghai 200234, China;
2. School of Urban and Regional
Science, East China Normal University, Shanghai 200241, China;
3. The Center for Modern
Chinese City Studies, East China Normal University, Shanghai 200062, China
Abstract: On the basis of 11315
enterprise credit information system and national enterprise credit information
publicity system, we obtained the data of headquarters and their branches of
producer service enterprises and then constructed spatial correlation network
of city agglomeration in the middle reaches of the Yangtze River (MRYR). Using
community detection algorithm including Modularity, PageRank value and
alluvial diagram, we analyzed the spatio-temporal evolution characteristics of
community structure of city agglomeration in the MRYR from 2000 to 2014. The
dataset is archived in .xlsx format with data size of 311 KB, including process
data and result data. The main results are as follows: (1) the spatial
correlation network of city agglomeration in the MRYR had gradually formed an
axle shape with Wuhan, Changsha and Nanchang as the radiative centers; (2) the
spatial correlation network could be divided into three internal closely
connected city communities, including Wuhan community, Changsha community and
Nanchang community; (3) three city communities constantly adjusted their
position in spatial correlation network; (4) the relationship between city
communities had the characteristics of imbalance and asymmetry; (5) the
administrative segmentation characteristics of city communities were obvious,
and the topological structure of ??core-sub core-edge?? was formed within each
city community.
Keywords: spatial correlation network; city community;
spatio-temporal evolution; city agglomeration in middle reaches of the Yangtze
River
DOI: https://doi.org/10.3974/geodp.2022.01.15
CSTR: https://cstr.escience.org.cn/CSTR:20146.14.2022.01.15
Dataset Availability Statement:
The dataset
supporting this paper was published and is accessible through the Digital Journal of
Global Change Data Repository at: https://doi.org/10.3974/geodb.2021.08.10.V1 or
https://cstr.escience.org.cn/CSTR:20146.11.2021.08.10.V1.
1 Introduction
The evolution of the spatial structure of
city agglomeration can be roughly divided into three development stages,
including the monocentric dominance, the polycentric competition and the networked
dependence and competition[1]. Among them, the networking of city
agglomeration is the highest manifestation of the dynamic flow of various
resource elements in the region, and it is also an ideal urbanization model in
the process of the formation and development of city agglomeration[2,3].
City agglomeration from the perspective of network and connection is similar to
the concept of ??functional area?? in economic geography[4]. Its
spatial organization emphasizes that the interaction intensity of cities within
the regional boundary is closer than that outside the boundary. Furthermore,
its spatial form is the aggregation of multiple cities with the central city as
the radiative core in a specific region. The competition between cities has
transformed into the competition between city agglomerations to a great extent[5].
Within the city agglomeration, the relationship between alliance and
competition is becoming more and more complex. Social network analysis and
complex network analysis bring new concepts and analysis paradigms to
geography, which provides strong support for insight into the internal spatial
organization of city agglomeration. With the help of agglomerative subgroup
algorithm such as subgroups and factions or community detection algorithm,
scholars generally find that there are several city groups or city communities
with ??close internal relations and sparse external relations??[6,8].
In April 2015, the State Council approved the development plan of city
agglomeration in the middle reaches of the Yangtze River, which clearly pointed
out that we should build it into a new growth pole of China??s economy and
promote the formation of a polycentric and networked development pattern. The
city agglomeration in the middle reaches of the Yangtze River (MRYR) is a
trans-provincial giant urban cluster composed of multiple urban subgroups
(including Wuhan metropolitan area, Changsha-Zhuzhou-Xiangtan city agglomeration
and Poyang Lake city agglomeration). The community spatial organization pattern
and its dynamic evolution trend of city agglomeration is the key to its
sustainable and healthy development. Therefore, based on the headquarters and
its branches of producer service enterprises, this paper constructs the dataset
of spatio-temporal evolution of community structure of city
agglomeration in MRYR from the perspective of urban network. The dataset can provide data support for studying and
optimizing the regional development pattern.
2 Metadata of the Dataset
The
metadata of the Spatio-temporal evolution dataset on community structure of
city clusters in middle reaches of the Yangtze River (2000‒2014)[9]
is summarized in Table 1. It includes the dataset
full name, short name, authors, year of the dataset, data format, data size, data
files, data publisher, and data sharing policy, etc.
3 Methods
3.1 Data Sources
Figure 1 clarifies the database building process. First, we used the
regional keyword query function of the 11315 National Enterprise Credit System
and entered a few keywords including ??subsidiary??, ??branch??, and ??office?? to
access branch names within study areas for the first query, while the business
directory of the headquarters is obtained simultaneously. Second, we registered
in the National Enterprise Credit Information Publicity System of the State
Administration for Industry and Commerce to utilize the enterprise directory
obtained for the second query to confirm and
supplement the required information one by one. Finally,
Table 1 Metadata
summary of the Spatio-temporal evolution dataset on community structure of city
clusters in middle reaches of the Yangtze River (2000‒2014)
|
Items
|
Description
|
|
Dataset full
name
|
Spatio-temporal
evolution dataset on community structure of city clusters in middle reaches
of the Yangtze River (2000‒2014)
|
|
Dataset
short name
|
CommunityStructure_MRYR
|
|
Authors
|
Gao, P.,
Shanghai Institute for Global City, Shanghai Normal University,
geogaopeng@163.com
He, D.,
Regional Science, East China Normal University, dhe@re.ecnu.edu.cn
Ning, Y. M.,
The Center for Modern Chinese City Studies, East China Normal University,
ymning@re.ecnu.edu.cn
|
|
Geographical
region
|
The area of
city agglomeration in the MRYR is 31.7??104 km2, including one sub-provincial city, 27 prefecture level
cities and three county-level cities in Hubei, Hunan and Jiangxi, with a
total of 178 county-level geographical units
|
|
Year
|
2000‒2014
|
|
Data format
|
.xlsx Data
size 311 KB
|
|
Data files
|
Matrix data
of spatial correlation network of city agglomeration in the MRYR, Modularity
data, PageRank value data, division of city connectivity data, inter-city
community??s connectivity data
|
|
Foundations
|
Key Project
of Chief Research Base of Humanities and Social Sciences of MOE
(17JJD790007); Shanghai Philosophy and Social Science Planning Project
(2021BSH001)
|
|
Data
publisher
|
Global
change research data publishing and repository, http://www.geodoi.ac.cn
|
|
Address
|
No. 11A,
Datun Road, Chaoyang District, Beijing 100101, China
|
|
Data sharing
policy
|
Data
from the Global Change Research Data Publishing & Repository includes metadata,
datasets (in the Digital Journal of Global Change Data Repository),
and publications (in the Journal of Global Change Data & Discovery). Data sharing
policy includes: (1) Data are openly available and can
be free downloaded via the Internet; (2) End users are encouraged to use Data
subject to citation; (3) Users, who are by definition also value-added
service providers, are welcome to redistribute Data subject to written
permission from the GCdataPR Editorial Office and the issuance of a Data
redistribution license; and (4) If Data are used to compile new
datasets, the ??ten per cent principal?? should be followed such that Data
records utilized should not surpass 10% of the new dataset contents, while
sources should be clearly noted in suitable places in the new dataset[10]
|
|
Communication and searchable system
|
DOI, CSTR, Crossref,
DCI, CSCD, CNKI, SciEngine, WDS/ISC, GEOSS
|
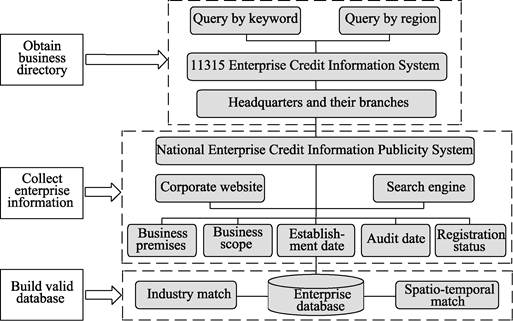
Figure 1 Building process for the producer
services database
according to the
Classification standard of national economy industry (GB/T 4754??2011) published
by the National Bureau of Statistics, the business scope of the collected
sample enterprises was classified, and thus the producer services involving six
industries are segregated, including transportation, warehousing and postal
services, information transmission, software and information technology
services, finance, real estate, leasing and business services, and scientific
research and technology services. Furthermore, we retained the samples of
headquarters and branches that are in remote locations according to the locations
of the enterprise headquarters and branch offices. Actually, it is in the
recent two decades that producer services undergo the rapid growth and become
the crucial contributor to regional network formation. Thus, we classified
samples chronologically to screen out sample enterprises of 2000, 2007, and
2014 respectively. Ultimately, we obtained a total of 11,564 effective samples.
3.2 Technical Route
Firstly, taking the connected
spatial units as the network nodes, the edges between the headquarters and branches
of producer service enterprises were extracted, and the spatial correlation
networks of urban agglomeration in the MRYR in 2000, 2007 and 2014 were
constructed respectively. Secondly, the spatial correlation network of urban
agglomeration in the MRYR was divided by using the Modularity index. Thirdly,
this paper calculated the PageRank value of each node in each city community
and drew the alluvial diagram of the dynamic evolution of city communities, and
then investigated the characteristics of imbalance and asymmetry between city
communities. Finally, we deeply analyzed the structural characteristics and
dynamic evolution of internal city communities.
(1) Modularity:
Some cities in the urban network will form several communities according to
their connectivity. The nodes in one city community are relatively closer,
while the links between city communities are relatively sparser. Newman et al. defined Modularity to
quantitatively describe city communities in the network and measure the quality
of community division[11].
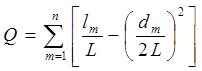 , m??n (1)
where Q indicates the
Modularity between 0 and 1??the closer the value to 1, the better division
quality of the community structure; n is the calculated number of city
communities; L is the total amount of urban links in the network; lm
is the connection quantity within the city community m; dm is the sum number of
connections associated with each node in city community m.
(2) PageRank algorithm: PageRank algorithm is an
algorithm used to rank the importance of nodes in the network[12].
The PageRank value of nodes is calculated as follows:
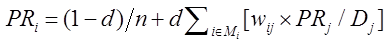 (2)
(2)
where PRi
is the PageRank value; n is the number of nodes in the network; Mi
is the number of nodes connected to node i; wij is the
connection between node i and node j; Dj is the
centrality of node j; d is the attenuation factor (usually 0.85).
(3) Alluvial diagram: The evolution process of
community structure includes not only the changes of nodes, relationships and
structures within city communities, but also the changes of relationships and
positions among city communities. The alluvial diagram method proposed by
Rosvall et al. can intuitively and
clearly show the evolution process of city community structure[13].
In the alluvial diagram, the name of each city community is named by the node
with the largest PageRank value within the city community; The position of the
city community represents its position in the network. The closer the city
community is to the bottom of the alluvial diagram, the higher its position is.
4 Data Results
4.1 Data Composition
The dataset included of: (1) matrix data of
spatial correlation network of city agglomeration in MRYR; (2) Modularity data
of spatial correlation network of city agglomeration in MRYR; (3) PageRank
value data of spatial correlation network of city agglomeration in MRYR; (4)
division of city communities?? data of spatial correlation network of city agglomeration in MRYR; (5)
inter-city community??s connectivity data of city agglomeration in MRYR. The
dataset is archived in .xlsx format with data size of 311 KB.
4.2 Data Results
(1) The city agglomeration in
the MRYR had gradually formed an axle shape with Wuhan, Changsha and Nanchang
as radiative centers. With the increase of the headquarters of producer service
enterprises in Wuhan, Changsha and Nanchang, the connection with surrounding
cities had gradually strengthened. By investigating the first contact city of
each city, it can be seen more clearly that the number of the most connected
edges including the three cities has soared from 45 in 2000 to 117 in 2014.
However, this reflected from the other side that the connection between many
other cities except the three cities was very weak, especially the connection
across the provincial administrative boundary, which will be further discussed
later.
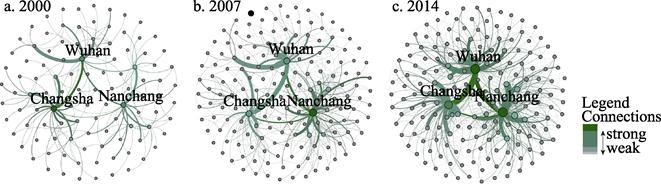
Figure 2 Spatial correlation network of city
agglomeration in the MRYR
|
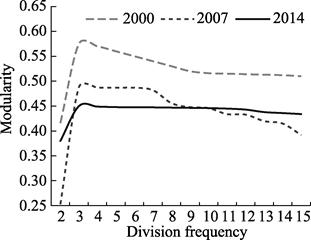
Figure 3 Modularity of spatial correla-
tion
network of city agglomeration in the MRYR
|
(2) The spatial correlation
network of city agglomeration in the MRYR had formed three closely connected city communities. Generally
speaking, if the Modularity reaches more than 0.3, it indicates that the
community structure in the network is obvious. The results showed that when the
division frequency of the spatial correlation network of city agglomeration in
the MRYR in 2000, 2007 and 2014 was set to 3 times, the Modularity reached the
maximum in the corresponding years, which were 0.575, 0.488 and 0.45,
respectively, and the effect of community division was the best, which meant
that the spatial correlation network of city agglomeration in the MRYR formed
three closely connected city communities. In addition, with the passage of
time, the Modularity showed a decreasing trend, indicating that the internal
structure of city associations was slightly loose, and the connection between
city associations was relatively obvious.
(3) The network status of city communities was in
dynamic change. Each city community was named after the city with the highest
PageRank value among it. The obtained city communities included Wuhan
community, Changsha community and Nanchang community. Then, the alluvial
diagram of spatio-temporal evolution of community structure of city
agglomeration in the MRYR was drawn based on the Mapequation platform[14].
The closer the city community is to the bottom of the alluvial diagram, the
higher its network status will be. From 2000 to 2007, there was no change in
members between city communities except that a small number of members of
Changsha community became members of the other two city communities
respectively; Nanchang community had the highest external connectivity and was
becoming more and more important in the network. Wuhan community had surpassed
Changsha community and became the second largest external connectivity
community in the network. From 2007 to 2014, the change range of members among
city communities increased significantly compared with the previous period, in
which a considerable number of members in Nanchang community evolved into
members of Wuhan community; Wuhan community once again surpassed Nanchang
community and became the city community with the highest external connectivity.
(4) The relationship between city communities had the
characteristics of imbalance and asymmetry. As shown in Figure 4, in 2000, the
relationship between Wuhan community and Changsha community was the closest,
followed by Wuhan community and Nanchang community, and the relationship
between Changsha community and Nanchang community was the weakest. In 2007,
Wuhan community and Nanchang community became the most closely connected pair.
In 2014, the connection strength between Wuhan community and Changsha community
as well as between Wuhan community and Nanchang community was similar, the
interaction between city communities was active. However, the connection
strength between Changsha community and Nanchang community was relatively weak.
It can be seen that there was a significant imbalance in the relationship
between the three city communities. Considering the leading connection flow,
the relationship between city communities was not symmetrical. In the three
years, Wuhan community was net outflow community, while Changsha community and
Nanchang community were always net inflow communities, indicating that Wuhan
community had strong external economic radiative ability and have economic
externalities on the other two city communities.
|
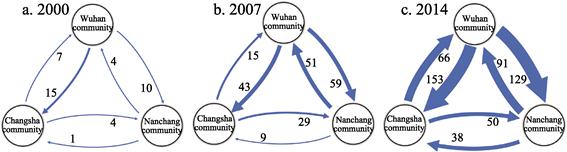
Figure 4 Inter-community directed
connection of city agglomeration in MRYR
(Note: The figures represent the number of branches of producer
service enterprises, that is, the one-way connection strength between city
communities)
|
(5) The administrative segmentation characteristic of
city communities was obvious, and the topological structure of ??core-sub
core-edge?? was formed within each city community.
Further research on the internal structure of urban communities can find that[14], on the one hand, the
provincial administrative boundary was the leading factor affecting the
evolution of community structure, and the phenomenon of ??community formation??
across provinces was becoming more and more rare. On the other hand, Wuhan,
Changsha and Nanchang were the core cities of city communities. Closely around
the core cities were municipal nodes, which played a leading role in the
secondary cores of each city community and were the important intermediary of
regional spatial configuration. However, a large number of county-level nodes
with remote geographical location, poor traffic conditions and weak economic
foundation were distributed on the edge of each city community.
5 Discussion
and Conclusion
Aiming at the phenomenon of
community-based spatial organization of city agglomeration in the middle
reaches of the Yangtze River (MRYR), this study compiles the spatio-temporal
evolution of community structure dataset of city agglomeration in the MRYR
(2000‒2014). This dataset not only helps to form a new understanding of the
spatial structure and organization of city agglomerations from the perspective
of urban network, but also provides basic data and reference for the
formulation of regional coordinated development policies. The data results
showed that during the study period, the spatial correlation network of urban
agglomeration in the MRYR had become increasingly close, forming an axle shape
with Wuhan, Changsha and Nanchang as the radiating centers. In each year, the
spatial correlation network of urban agglomerations in the MRYR was divided
into three city communities: Wuhan community, Changsha community and Nanchang
community. The status of three city communities in the network constantly
adjusted, and the relationship between different city communities was
unbalanced and asymmetric. In addition, with the passage of time, the
phenomenon of ??community formation?? across provinces disappeared, city
communities were obviously divided by administrative boundaries, and a ring
hierarchical structure was formed within each one.
This study digs the directory of enterprise
headquarters and their branch enterprises from network big data, uses the
national enterprise credit information publicity system to verify the accuracy
of the data and further supplement effective information. It is a beneficial
attempt to combine enterprise network big data with official data, which not
only reflects the timeliness of the data, but also ensures the reliability of
the data. In addition, this study also combines social network analysis with
spatial analysis, reveals the phenomenon of community spatial organization of
city agglomeration from the perspective of urban network, and can provide a
more scientific empirical analysis path for relevant research. It should be
noted that the enterprise headquarters branch data in this dataset is the
number of invested enterprises. In the follow-up work, it is necessary to mine
the investment quota data to build a spatial association network more
accurately.
Author
Contributions
He, D. and Ning, Y. M. set up
the framework for the development of the dataset; Gao, P. and He, D. completed
the data collection, processing and verification; Gao, P. completed the data
operation and wrote the paper.
Conflicts of Interest
The authors declare no conflicts of interest.
References
[1]
Scott, A. J. Global City-Regions: Trends, Theory, Policy [M]. New
York: Oxford University Press, 2001.
[2]
Nian, F. H., Yao, S. M., Chen, Z. G. The preliminary study on the
network organization in urban agglomeration [J]. Scientia Geographica Sinica,
2002, 22(5): 568?C573.
[3]
Pan, F. H., Fang, C., Li, X. D. The progress and prospect of research
on Chinese city network [J]. Scientia Geographica Sinica, 2019, 39(7):
1093?C1101.
[4]
Anderson, W. Economic Geography [M]. New York: Routledge, 2012.
[5]
Zhang, F., Ning, Y. M., Lou, X. Y. Competitiveness and regional
inequality of China??s mega-city regions [J]. Geographical Research,
2019, 38(7): 1664?C1677.
[6] Fang,
D. C., Sun, M. Y. The reconstruction of the spatial structure of the Yangtze
River Delta city group in the high-speed rail era: based on the social network
analysis [J]. Economic Geography, 2015, 35(10): 50?C56.
[7]
Zhang, W. Y., Derudder, B., Wang, J. E., et al.
Regionalization in the Yangtze River Delta, China, from the perspective of
inter-city daily mobility [J]. Regional Studies, 2018, 52(4): 528?C541.
[8]
Gao, P., He, D., Sun, Z. J., et
al. Characterizing functionally integrated regions in Central Yangtze River
Megaregion from a city-network perspective [J]. Growth and Change, 2020,
51: 1357?C1379.
[9]
Gao, P., He, D., Ning, Y. M. Spatio-temporal evolution of
community structure dataset of city agglomeration in the middle reaches of the
Yangtze River (2000‒2014) [J/DB/OL]. Digital
Journal of Global Change Data Repository, 2021.
https://doi.org/10.3974/geodb.2021.08.10.V1. https://cstr.escience.
org.cn/CSTR:20146.11.2021.08.10.V1.
[10]
GC dataPR Editorial Office. GC dataPR data sharing policy [OL].
https://doi.org/10.3974/dp.policy. 2014.05 (Updated 2017).
[11]
Newman, M. E. Finding community structure in networks using the
eigenvectors of matrices [J]. Physical Review E: Statistical Nonlinear & Soft Matter
Physics, 2006, 74(3): 1?C22.
[12]
Brin, S., Page, L. Reprint of: the anatomy of a large-scale
hypertextual web search engine [J]. Computer Networks, 2012, 56(18):
3825?C3833.
[13]
Rosvall, M., Bergstrom, C. T. Mapping change in large networks
[J]. PLoS One, 2010, 5(1): 1?C7.
[14]
Gao, P., He, D., Ning, Y. M., et al. Community structure
and proximity mechanism of city clusters in middle reaches of the Yangtze
River: based on producer service firms?? network [J]. Scientia Geographica
Sinica, 2019, 39(4): 578?C586.