Soil Erosion Change Dataset of China (1985-2011)
Wang, Z. X.* Li, F.
Institute of Geographical Sciences and Natural Resources Research??State Key Lab of Resources and Environmental Information System??Beijing 100101, China
Abstract: Soil erosion is the displacement of the upper layer of soil caused by the dynamic activity of erosive agents. Four surveys have been conducted about soil erosion in China since 1985, and the provincial summaries of soil erosion were published in various sources (mainly in printed version). This dataset was the result of compilation and preliminary analysis about these publications, which was organized in 2 erosion types (water erosion, wind erosion), 5 erosion severity grades (light, moderate, intense, extremely intense, and severe ), 4 epochs (1985, 1995, 2000, 2011), and 31 provinces. The preliminary analysis showed that, in national level, the ratio of water erosion and wind erosion in 2011 was 44??56, and the percentage of 5 erosion severity grades were light 47%, moderate 19%, intense 13%, extremely intense 10%, and severe 11%. During 1985-2011, soil erosion in China as a whole has been in decline, from 366.14×10⁴ km2 (1985), through 354.7×10⁴ km2 (1995) and 356.1×10⁴ km2 (2000), to 294.92×10⁴ km2 (2011), corresponding to a percentage decline from 38.53% in 1985 to 31.04% in 2011. In terms of erosion types, water erosion experienced a steady decrease during 1985-2011, yet wind erosion area was volatile from epoch to epoch, although also demonstrating a general declining pattern. In provincial level during 1985-2011, the first three provinces with the largest drop in percentage of eroded land were Ningxia (75.04%-37.87%), Shaanxi (64.15%-35.33%), and Henan (39.26%-14.23%). Meanwhile, four provinces had an increase in soil erosion: Guangxi (4.71%-21.35%), Guangdong (6.4%- 11.98%), Hainan (1.33%-3.2%), and Jilin (20.89%-25.28%). The dataset is composed of 6 tables in 1 excel files, with a size of 44.5 KB.
Keywords: soil erosion; water erosion; wind erosion; erosion severity; China
1 Introduction
Soil erosion is the displacement of the upper layer of soil caused by the dynamic activity of erosive agents (water, wind, etc.). In accordance with these agents, erosion is divided into water erosion, wind erosion, etc[1]. Although there are many terms in academic community related to soil erosion (like soil degradation, desertification and sandification, water and soil loss), in terms of actual dataset, only two relevant serials exist at national level in China: one is from the National Soil Erosion Survey (NSES) organized by the Ministry of Water Resources (MoW), P. R. China, which started from 1985 and has conducted the survey four times (1985, 1995, 2000, 2011)[2–5]; the other is from the National Desertification and Sandification Survey (NDSS) organized by the State Forestry Administration (SFA), which started from 1993 and has conducted the survey five times (1993, 1999, 2004, 2009, 2014)[6]. At face value, part of the soil erosion data (statistics at provincial level) have been officially published by MoW after each round of survey, but surfing the free internet suggested that there was no expected soil erosion data, only news about data publication. After many hard work and a little luck, three datasets were finally found in journals (print version, library archive), and one dataset was spotted at a proprietary journal database. After the frustration about dataset collection, came the confusion about dataset understanding, because MoW has no consistent nomenclature for these four datasets and the technologies used in surveys have evolved over times. The paper streamlined the technical standards used in four MoW soil erosion surveys by combing key publications, compiled soil erosion dataset of China by 2 erosion types (water erosion, soil erosion), 5 erosion severity grades (light, moderate, intense, extremely intense, and severe ), 4 epochs (1985, 1995, 2000, 2011), and 31 provinces[7]. A preliminary analysis was also presented about status and dynamic of soil erosion in China both at national and provincial levels.
2 Metadata of Dataset
The major elements of soil erosion change dataset of China (1985-2011)[7] were listed in Table 1.
Table1 Metadata summary of soil erosion change dataset of China (1985, 1995, 2000, 2011)
|
Items
|
Description
|
|
Dataset full name
|
Soil erosion change dataset of China (1985-2011)[8]
|
|
Dataset short name
|
SoilErosionChina_1985-2011
|
|
Authors
|
Wang, Z. X. L-5255-2016, Institute of Geographical Sciences and Natural Resources Research??Chinese Academy of Sciences, wangzx@igsnrr.ac.cn
Li, F. L-3424-2018, Institute of Geographical Sciences and Natural Resources Research??Chinese Academy of Sciences, lif@igsnrr.ac.cn
|
|
Geographical region
|
31 provinces (not include Hong Kong, Macao, and Taiwan )
|
|
Time
|
1985, 1995, 2000, 2011
|
|
Data format
|
.xlsx Data size 44.5 KB
|
|
Data files
|
(1) Soil erosion dataset of China at provincial level (1985, 1995, 2000, 2011); 4 tables
(2) Soil erosion percent and change dDataset in China at provincial level (1985-2011); 2 tables
|
|
Foundation(s)
|
Ministry of Science and Technology of P. R. China (2016YFA0600201);
Chinese Academy of Science (XDA19080303, TSYJS04)
|
|
Data publisher
|
Global Change Research Data Publishing and Repository, http://www.geodoi.ac.cn.
|
|
Address
|
No. 11A, Datun Road, Chaoyang District, Beijing 100101, China
|
|
Data sharing policy
|
Data from the Global Change Research Data Publishing & Repository includes metadata, datasets (data products), and publications (in this case, in the Journal of Global Change Data & Discovery). Data sharing policy includes: (1) Data are openly available and can be free downloaded via the Internet; (2) End users are encouraged to use Data subject to citation; (3) Users, who are by definition also value-added service providers, are welcome to redistribute Data subject to written permission from the GCdataPR Editorial Office and the issuance of a Data redistribution license, and; (4) If Data are used to compile new datasets, the ‘ten percent principal’ should be followed such that Data records utilized should not surpass 10% of the new dataset contents, while sources should be clearly noted in suitable places in the new dataset[9]
|
3 Methodologies
Major technical specifications about four soil erosion surveys organized by MoW were summarized in Table 2 and briefed in the followings.
Table 2 Major technical specifications for National Soil Erosion Surveys (NSES) in China (mid of 1980s, mid of 1990s, early 2000, 2011)
|
|
The first NSES
|
The second NSES
|
The third NSES
|
The fourth NSES
|
|
Epoch
|
1985-1986
|
1995-1996
|
2000-2001
|
2011
|
|
Standard
|
Mainstream Academic
|
MoW standard
SL190—1996
|
MoW standard
SL190—1996
|
MoW standard
SL190—2007
|
|
Image
|
MSS ??80m??
|
TM (30m)
|
TM(30m),CBERS(30m)
|
HJ-1A/B CCD (30 m)
|
|
Interpretation
|
Manual interpretation
based on
transpanrency overlay
|
Human-computer interaction
|
Human-computer interaction??focus on change detection and characterization
|
Field survey unit (FSU) based on stratified sampling; soil erosion modulus calculated for each FSC; spatially interpolated to whole area
|
|
Technical
Specification
|
Guidelines of
National Soil Erosion Survey and Mapping Using Remote Sensing
|
Guidelines of
National Soil Erosion Survey Using Remote Sensing
|
Guidelines of
National Soil Erosion Update Survey Using Remote Sensing
|
Implementation scheme of the first national water survey?Dwater and soil conservation
|
|
Scale
|
1??500,000
|
1??100,000
|
1??100,000
|
1??100,000
|
3.1 Nomenclature and Representative Time of Four Soil Erosion Datasets from MoW
First of all, it should be kept in mind that there are two partially overlapped serials of dataset about soil erosion in China: one from MoW, and the other from SFA. The wind erosion in MoW dataset may be called desertification and sandification in SFA dataset, therefore they are partially overlaid, conceptionally and spatially[6].
There were no consistent titles for these four soil erosion surveys and datasets. In fact and to the best of our knowledge, there was no specific paper devoted to “the first soil erosion survey”, only one publication about the comparison of the first and the second surveys 15 years later[2]. The third in 2010 followed the second soil erosion survey in 1995 seemingly smoothly, but, instead of the expected fourth soil erosion survey, there came “the First National Water Survey—Soil Erosion Survey” in 2013. While some confusion may certainly come with these inconsistent titles, the comprehensive literature reviews suggest that these four dataset are largely consistent, from soil erosion definition to key technology applications.
The administrative division adjustment (ADD): there were two ADDs at provincial level during 1985-2011, one was the Hainan province, split from Guangdong province in 1987; the other was Chongqing Municipality, split from Sichuan province in 1997. This change has no effect for Hainan province, since the soil erosion dataset in Hainan adapted the ADD during the first soil erosion survey. As for Chongqing, its independent data was not available until 2011, therefore, it is necessary to remerge Chongqing and Sichuan for change detection.
The clarification of the titles and represented time of four soil erosion datasets from MoW were mainly based on four publications. Zeng and Li (2000) [2–3] explored the first and the second soil erosion surveys, Zhao et al. (2002)[4] explained the methodologies to update database from 1995 to 2000; Li et al.[5] explored the soil erosion survey in 2011. All lead authors were the actual lead organizer of these four soil erosion surveys.
3.2 Consistency of Four National Soil Erosion Surveys: Soil Erosion Definition
Although there was no MoW standard for soil erosion severity grade before 1985 and various MoW standards were adopted for erosion surveys during 1995-2007, the definitions of erosion severity were virtually the same. Table 3 and Table 4 are excerpts from MoW standard “Soil Erosion Classification and Grade (SL190-1996)”[10]. The “light and above” in severity grade was classified as soil erosion.
Table 3 Water erosion severity grade
|
Grade
|
Erosion modulus (t/(km2·a))
|
Erosion rate (mm/a)
|
|
Slight
|
(a)<200; (b)<500; (c)<1000
|
(a) <0.15, (b) <0.37, (c) <0.74
|
|
Light
|
(a)200; (b)500; (c)1,000-2,500
|
(a) 0.15??(b) 0.37??(c) 0.74-1.9
|
|
Moderate
|
2,500-5,000
|
1.9-3.7
|
|
Intense
|
5,000-8,000
|
3.7-5.9
|
|
Extremely intense
|
8,000-15,000
|
5.9-11.1
|
|
Severe
|
>15,000
|
>11.1
|
Soil bulk density=1.35 g/cm3.
(a) Dark soil in NE China, and mountains in N China; (b) Red soil in S China hill, SW Mountains; (c) Loess Plateau in NW China.
Table 4 Wind erosion severity grade
|
Grade
|
Landscape
|
Stable sand??%??
|
Erosion rate
??mm/a??
|
Erosion modulus (t/(km2·a))
|
|
Slight
|
Fixed dunes
|
>70
|
<2
|
<200
|
|
Light
|
Fixed and semi-fixed
|
70-50
|
2-10
|
200-2,500
|
|
Moderate
|
Semi-fixed
|
50-30
|
10-25
|
2,500-5,000
|
|
Intense
|
Semi-fixed and
Shifting dune
|
30-10
|
25-50
|
5,000-8,000
|
|
Extremely Intense
|
Shifting dune
|
<10
|
50-100
|
8,000-15,000
|
|
Severe
|
Large shifting dune
|
<10
|
>100
|
>15,000
|
3.3 Inconsistency of Four National Soil Erosion Surveys
The adoption of new technologies did bring some inconsistencies:
(1) The first NSES was exploratory, using 80 m satellite images and transparency overlay for interpretation.
(2) The second and the third NSES were similar, in fact, the third NSES focused on interpretation of changed polygons using man-computer interaction.
(3) The fourth NSES was sampling based: first, field survey units (FSU) were obtained; second, soil erosion modulus was modeled for each FSU; finally, soil erosion modulus in FSU was interpolated to all area.
3.4 Major Data Sources for China Soil Erosion Change Dataset
Table 5 summarized the major data sources for this dataset and their availability. All data (except for internal print) were official publications from MoW, although some publications did not clarify the title and time, and not available in the public domain. It is worth noting that “the First National Water Survey—Water and Soil Conservation” is actually the fourth NSES in this dataset.
4 Dataset and Data Quality Control
4.1 Dataset
The dataset consists of one excel file with 6 tables:
(1) [Table 1-Table 4], Soil erosion dataset of China at provincial level. Organized by 2 erosion types (water erosion, soil erosion), 5 erosion severity grades (light, moderate, intense, extremely intense, severe), 4 epochs (1985, 1995, 2000, 2011), and 31 provinces.
(2) [Table 5-Table 6], soil erosion percent and change dataset in China at provincial level (1985-2011).
The preliminary analysis of the status and dynamics of soil erosion in China are as followings, both at national and provincial levels.
Table 5 Major data sources for China soil erosion change dataset (1985, 1995, 2000, and 2011)
|
Epoch
|
Data sources
|
Print
|
Digital
|
|
1985
|
1. Center for RS Application, MoW. Statistics of China Soil Erosion using Remote Sensing (Internal, 1990)
2. MoW. The latest results of national soil erosion survey using remote sensing (1993)[11]
3. MoW, Chinese Academy of Science, Chinese Academy of Engineering. Water and Soil Conservation and Eco-security in China?D Soil Erosion Dossier (2010) [12]
|
√
√
√
|
×
×
×
|
|
1995
|
1. MoW. The latest results of national soil erosion survey using remote sensing (2002) [13]
2. (2010) [11]
|
√
√
|
×
×
|
|
2000
|
1. (2010) [11]
|
√
|
×
|
|
2011
|
1. MoW. Bulletin of the first national water survey—water and soil conservation survey (2013) [14]
|
√
|
√
|
4.1.1 The Status and Dynamics of Soil Erosion in China: National
(1) Status in 2011 (Figure 1a and 1b): The area of soil erosion was 294.92×10⁴ km2 in 2011, accounting for 31.04% of the surveyed area. The ratio of water erosion and wind erosion was 44??56, and the severity grade percentage was light 47%, moderate 19%, intense 13%, extremely intense 10%, and severe 11%, respectively.
(2) Dynamics during 1985-2011 (Figure 1c):
During 1985-2011, soil erosion as a whole has been in decline, from 366.14×10⁴ km2 (1985), through 354.77×10⁴ km2 (1995) and 356.14×10⁴ km2 (2000), to 294.92×10⁴ km2 (2011), corresponding to a percentage decline from 38.53% in 1985 to 31.04% in 2011. In terms of erosion types, water erosion experienced a steady decrease during 1985-2011, yet wind erosion area was volatile from epoch to epoch, although also demonstrating a general declining pattern.
4.1.2 The Status and Dynamics of Soil Erosion in China: Provincial
(1) The Status in 2011 (Figure 2a): The average percent of eroded land in 2011 was 31.04% in China, and eight provinces had higher percentages than national average, most located in NW China.
(2) The Dynamics during 1985-2011: The average percent drop of eroded land during 1985-2011 was 7.49% in China, and the first five provinces with sharpest drop during 1985-2011 were Ningxia (75.04%-37.87%), Shaanxi (64.15%-35.33%), Henan (39.26%-14.23%), Shanxi (68.77%-44.84%), and Shandong (39.17%-17.59%). Meanwhile, five provinces had seen the expansion of soil erosion area: Guangxi (4.71%-21.35%), Guangdong (6.4%-11.98%), Hainan (1.33%-3.2%), Jilin (20.89%-25.28%), and Shanghai (0-0.06%), Figure 2b.
4.2 Data Validation and the Scale Effect of Data Quality
Four soil erosion surveys of China spanned over 26 years, and the progressive methodologies for these surveys rendered certain data quality evolutions, although generally each dataset has withstood rigid quality control procedures.
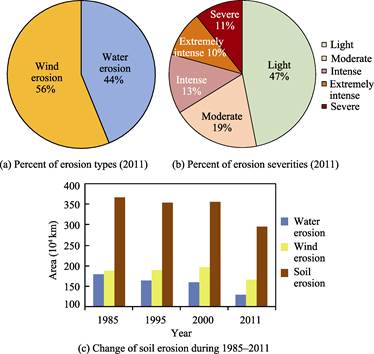
Figure 1 China soil erosion: class, severity, and change
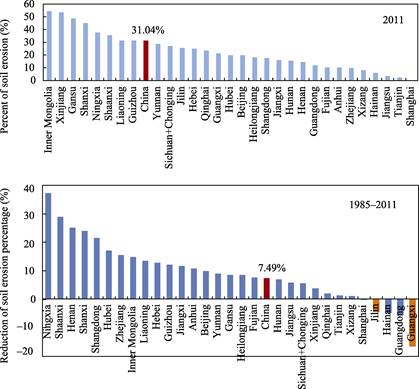
Figure 2 China soil erosion at provincial level: percent and change
4.2.1 Data Validation
All datasets meet the major quality criteria[15]:
·Percent of samples ( polygon for the 1st-3rd survey; field survey unit for the 4th survey) for validation: ≥5%;
·Accuracy of interpretation: ≥90%;
·Accuracy of geo-location: ≤60 m.
4.2.2 Scale Effect of Data Quality and its impact on Change Detection
(1) It is tempting to conduct change detection analysis with a time serial dataset in hand, that is one of the common applications for such data as soil erosion. But users should not regard the current dataset as their only base for any major analysis, and should take the scale effect of data quality into considerations. Since the spatial scale has been getting smaller during serial surveys, some formerly ignored erosions might be included in the later surveys.
(2) For instance, the dataset showed that four provinces had a soil erosion expansion trend during 2000-2011, they were outliers in 31 provinces because other provinces had got their erosion under check after huge investment in water and soil conservation in the previous years. What might be the causes for this erosion expansion?
(3) It could be both real erosion enlargement and an effect of methodology evolution.
(4) Literatures[16–18] confirmed that rapid economic developments resulted to new soil erosions in coastal regions such as Guangdong, Guangxi, and Hainan, and the soil erosion types included soil erosion in urban area and orchard.
(5) However, literatures[19] confirmed that new methodology used in 2011 survey was another reason for the enlarged erosion in these four provinces. Specifically, “erosion under canopy” was not detected using remote sensing alone (the 1st-3rd survey), but detected using field survey (the 4th survey), that was the case for coastal provinces like Guangdong, Guangxi, and Hainan, where only dense forests could effectively conserve soils. Jilin in NE China was another “outlier” because the light erosion in gentle but very long slope (<5°) was not detected in the 1st – 3rd survey and detected in the 4th survey. In other words, soil erosion in these four provinces was underestimated before 2011, and the erosion expansion was partly false change detection.
5 Conclusion and Recommendation
Soil erosion (Soil and water loss) has been one of the major environmental issues in China, and many efforts have been put to slow down or even to reverse this process. Meanwhile, many efforts were also made to monitor the changes resulted from the water and soil conservation activities. This data paper combed the major technical specifications for four soil surveys organized by the Ministry of Water Resources, P. R. China (MoW), and compiled the soil erosion change dataset of China, by 2 erosion types (water erosion, wind erosion), 5 erosion severity grades (light, moderate, intense, extremely intense, severe), 4 epochs (1985, 1995, 2000, 2011), and 31 provinces. The preliminary analyses of the dataset were as follows.
At national level, the total soil erosion was on decline during 1985-2011, the areas of eroded land were 366.14×10⁴ km2, 354.77×10⁴ km2, 356.14×10⁴ km2, and 294.92×10⁴ km2, for 1985, 1995, 2000, and 2011, respectively. The percentage of eroded land decreased from 38.53% to 31.04% during 1985-2011, with a steady reduction from water erosion, and a decrease trend for wind erosion but with inter-epoch dynamics.
At provincial level, the first five provinces with the largest drop for soil erosion percentage were Ningxia (75.04%-37.87%), Shaanxi (64.15%-35.33%), Henan (39.26%-14.23%), Shanxi (68.77%-44.84%), and Shandong (39.17%-17.59%). Conversely, four provinces had seen their expansion of soil erosion.
The results of four soil surveys by MoW have certainly help to make better decision for various governances, but there are more possibilities to fulfill their potentials. For instance, in terms of soil erosion monitoring, it might be more economic and effective for MoW and the State Forestry Administration (SFA) to combine the survey for soil erosion and survey for desertification and sandification.
Author Contributions
Wang, Z. X. designed the study and wrote this data paper, Li, F. was in charge of data collect, data processing, and data quality control.
References
[1] National Standards of the People’s Republic of China. Water and soil conservation terms (GB/T 20465—2006) [S]. Beijing: China Water Power Press, 2006.
[2] Zeng, D. L., Li, Z. G. Practice and considerations of the second national soil erosion survey using remote sensing [J]. Soil and Water Conservation in China, 2000, 1: 28-31.
[3] Ministry of Water Resources. Guidelines of National Soil Erosion Survey and Mapping Using Remote Sensing [R]. 1986.
[4] Zhao, X. L., Zhang, Z. X., Liu, B., et al. Method of monitoring soil erosion dynamic based on remote sensing and GIS [J]. Bulletin of Soil and Water Conservation, 2002, 22(4): 29-32.
[5] Li, Z. G., Liu, X. C., Liu, J. X., et al. Plan of soil and water conservation survey in national census for water resources [J]. Bulletin of Soil and Water Conservation, 2010, 30(3): 87-91.
[6] Tu, Z. F., Li, M. X., Sun, T. The Status and trend analysis of desertification and sandification [J]. Forest Resources Management, 2016, 1: 1-5, 13.
[7] Wang, Z. X.??Li, F. Soil erosion change dataset of China (1985-2011) [DB/OL]. Global Change Research Data Publishing & Repository, 2018. DOI: 10.3974/geodb.2018.04.05.V1.
[8] GCdataPR Editorial Office. GCdataPR Data Sharing Policy [OL]. DOI: 10.3974/dp.policy.2014.05 (Updated 2017).
[9] National Standards of the People’s Republic of China. Standard for soil erosion classification and grade (SL190—1996) [S]. Beijing: China Water Power Press, 1996.
[10] Ministry of Water Resources. The latest results of National Soil Erosion Survey using remote sensing [J]. Soil and Water Conservation in China, 1993, 3: 1-2.
[11] Ministry of Water Resources, Chinese Academy of Science, Chinese Academy of Engineering. Water and Soil Conservation and Eco-security in China?DSoil Erosion Dossier [M]. Beijing: Science Press, 2010.
[12] Ministry of Water Resources. Bulletin of national soil erosion [J]. Soil and Water Conservation in China, 2002, 2: Cover 4.
[13] Ministry of Water Resources. Bulletin of the first national water survey?Dsoil erosion survey [J]. Soil and Water Conservation in China, 2013, 10: 2-3, 11.
[14] Li, Z. G. Data quality management for national soil erosion survey using remote sensing [J]. Science and Technology Information for Water and Soil Conservation, 2001, 2: 11-14.
[15] Sun, X. L., Gong, P. J., Lin, M. L., et al. Soil and water conservation survey in Guangdong province and its achievement analysis [J]. Guangdong Water Resources and Hydropower, 2014, 12: 56-59.
[16] Liang, G. Y. Soil erosion evolution trends of Guangxi and analysis of causes [J]. Guangxi Water Resources and Hydropower Engineering, 2014, 4: 71-73.
[17] Lin, Y. Status and solutions of water and soil conservation in Hainan province [J]. Soil and Water Conservation in China, 2015, 3: 7-9.
[18] Liu, B. Y., Guo, S. Y., Li Z. G., et al. Sampling-based water erosion survey in China [J]. Soil and Water Conservation in China, 2013, 10: 26-34.