4868
Sample Plots Dataset for Land Cover Validation in Fujian Province of China (2019)
??Content
and Procedure
Chen, Y. L. Huang, X. Y. Lu, D. S.* Liu, S. S. Lin, W. K. Peng, Z. W. Wu, Y. F. Pang, S.
Y. Zhao, S.
School of Geographical Sciences, Fujian Normal
University, Fuzhou 350007, China
Abstract: The land cover survey data is of fundamental importance to the
validation of land cover classification products. The survey process of land
cover types in Fujian province in 2019 is introduced in this paper. The process
includes three steps, including designing of land cover type system, proceeding
of field survey and inspecting of field data indoor. A total of 4,846 field
points were collected, including 1,057 for pure coniferous forest, 164 for
mixed coniferous forest, 1,313 for pure broadleaf forest, 141 for mixed
broadleaf forest, 91 for conifer-broadleaf mixed forest, 808 for bamboo, 10 for
mangrove, 226 for pure shrub, 30 for mixed shrub, 35 for grassland, 145 for paddy
field crop, 223 for non-paddy field crop, 270 for artificial surface, 270 for
water, 32 for bare soil and 31 for bare rock. The shared files
with data size of 39.1 MB includes datasets of 4,846 sampling points and
photos taken in situ survey. Sample points are archived in .kmz and .shp
respectively with a total data size of 7.05 MB.
Keywords: Fujian province; land
cover; survey dataset; 2019
1 Introduction
Land cover is refer to the composition of various matters
on the earth's surface covered above the soil circle[1].
The spatial and temporal distribution of land cover is the result of
interaction and feedback between surface environment and human activities, and
determines the balances and distribution process of surface energy (e.g.,
latent heat and sensible heat) and matter (e.g., carbon and water)[2?C5].
Research of land cover and its change is one of the hotspots among global
change studies[6?C10]. Land cover
data product is vitally important for the study of land change processes,
trends, driving forces of land use / land cover and their ecological,
hydrological and environmental effects[2?C3,11?C15].
The field survey is an indispensable work to map highly accurate land cover
products.
Compared
with the huge demand, the public validation data of the global land cover classification
products is relatively lacking at present[16?C17].
Two approaches, including interpretation of high-resolution remote sensing data
and field survey, are commonly implemented to obtain validation data. The
interpreted validating data can be produced with less time, labor and financial
resources with relatively high accuracy in a
short time. However, its accuracy also can be limited by the raw image quality,
artificial factors and inconsistent acquisition date. In addition, interpreted
validating data cannot ensure the authenticity of the validation sample
especially for the fine land cover products which field survey can do. The
using of field survey data to validate land cover classification products is
the most accurate approach, although it consumes a lot of labor and financial
resources. At present, the public field survey data at global or regional scale
is extremely limited. Therefore, realizing the sharing of field survey can
greatly promote the development of land cover change research.
Fujian province is located in the southeast of China,
covering a land area of 12.14´104 km2. Fujian is a relatively independent geographical
unit in geomorphology and hydrology because it is front to the sea and back to
high mountains. Its land area is separated from the surrounding three provinces by mountains with an altitude of
more than 1,000 m. Generally, there are more hills, and less plain in Fujian.
Thus, Fujian is also known as ??Eight tenth mountain, one tenth water body and
one tenth cropland??. Belonged to humid sub-tropical monsoon climate, Fujian is
warm and humid in spring, hot and humid in summer, warm and dry in autumn and
cold and humid in winter and the annual precipitation is between 1,000 mm and 2,200
mm, with an average of 1,670 mm. The vegetation in Fujian are complex and
diverse, with many kinds of plants, including south subtropical rainforest,
mid-subtropical evergreen broadleaf forest, conifer-broadleaf mixed forest, coniferous
forest, bamboo, mangrove, subtropical shrub-grassland, mountain meadow, etc.
Due to the complexity of terrain and diversity of vegetation types, field
survey data is urgently necessary for land cover research in this area. This
paper aims to provide the field survey data for the land cover classification
research on this area to promote the development of research on land cover
change, processes, driving forces, and its ecological and hydrological impacts
and effects on this area.
2 Metadata of the Dataset
The metadata of ??In situ dataset of land cover
types in Fujian province (2019)?? [18]
is summarized in Table 1, including the dataset name, authors, geographical
region, year, data files, data publisher and data sharing policy, etc.
3 Processes and Methods of Data Collection
The entire process of data collection was divided into three
parts, including preparation of field survey, proceeding of field survey and
inspection of collected data.
The preparation of field
survey includes four parts. Firstly, the main land cover types were listed out
based on substantial literature of land cover in Fujian province. Secondly,
according to the main land cover types in Fujian province, a land cover survey
system was designed. As shown in Table 2, the land cover survey system was
designed as three levels[7]. The Level 1 includes forest, shrub, grassland,
crop, artificial surface, bare land and water. The Level 2 includes 11 types.
Forest types were divided into coniferous forest, broadleaf forest,
conifer-broadleaf mixed forest, bamboo and mangrove. The rest of Level 1 types were not divided further. The Level 3 includes 16 types.
Coniferous forest types were di-
Table 1 Metadata summary of ??In situ
dataset of land cover types in Fujian province (2019)??
|
Items
|
Description
|
|
Dataset
full name
|
In
situ dataset of land cover types in Fujian province (2019)
|
|
Dataset
short name
|
LC_Survey_FJ2019
|
|
Authors
|
Chen, Y. AAP-3042-2020, School of Geographical Sciences,
Fujian Normal University, chenyl@fjnu.edu.cn
Huang, X., School of Geographical Sciences, Fujian Normal
University, hxy1050250101@163.com
Lu, D. AAT-3553-2020, School of Geographical
Sciences, Fujian Normal University, ludengsheng@fjnu.edu.cn
Liu, S. AAT-3465-2020, School of Geographical Sciences,
Fujian Normal University, xinqingweiyu@163.com
Lin, W. AAT-3956-2020, School of Geographical
Sciences, Fujian Normal University, wenkelin0210@gmail.com
Peng, Z., School of Geographical Sciences, Fujian Normal
University, 13420173263@163.com
Wu, Y., School of Geographical Sciences, Fujian Normal
University, yfwu111@163.com
Pang, S., School of Geographical Sciences, Fujian Normal
University, elvishpang@gmail.com
Zhao, S. AAT-3964-2020, School of Geographical Sciences,
Fujian Normal University??ygwork123@163.com
|
|
Geographical
region
|
23??32¢N?C28??19¢N,
115??50¢E?C120??43¢E
|
|
Year
|
2019
|
|
Data
format
|
.jpg, .docx, .kmz, .shp Data
size 39.1 MB
|
|
Data
files
|
Land cover date of Level 1, 2, 3, and photos
and description of Level 3
|
|
Foundation(s)
|
Ministry of Science and Technology of
P. R. China (2017YFD0600900)
|
|
Data
computing environment
|
Aowei Interactive
Map, Google Earth and ArcGIS
|
|
Data
publisher
|
Global Change
Research Data Publishing & Repository, http://www.geodoi.ac.cn
|
|
Address
|
No. 11A, Datun Road, Chaoyang District,
Beijing 100101, China
|
|
Data
sharing policy
|
Data from the Global Change Research Data
Publishing & Repository includes metadata, datasets (data products), and
publications (in this case, in the Journal
of Global Change Data & Discovery).
Data sharing policy includes: (1) Data
are openly available and can be free downloaded via the Internet; (2) End
users are encouraged to use Data subject to citation; (3)
Users, who are by definition also value-added service providers, are welcome
to redistribute Data subject to written permission from the GCdataPR Editorial
Office and the issuance of a Data redistribution license; and (4)
If Data
are used to compile new datasets, the ??ten percent principal?? should be
followed such that Data records utilized should not
surpass 10% of the new dataset contents, while sources should be clearly
noted in suitable places in the new dataset[19]
|
|
Communication
and searchable system
|
DOI, DCI, CSCD, WDS/ISC, GEOSS,
China GEOSS, Crossref
|
vided into pure coniferous forest and mixed coniferous forest.
Broadleaf forest types were divided into pure broadleaf forest and mixed
broadleaf forest. Conifer-broadleaf mixed forest, bamboo and mangrove were no
divided further. Shrub types were divided into pure shrub and mixed shrub. Crop
types were divided into paddy field crop and non-paddy field crop. Artificial
surface and water were not divided further. Bare land was divided into bare
soil and bare rock. Thirdly, a detail field survey questionnaire was made
(Table 3). Finally, the survey routes were designed. In consideration of safety
and convenience, rural roads are preferred.
During
process of field survey, it was conducted through the interaction between
manual operation and mobile phone software. Firstly, typical land cover points
(Level 3) were selected by visual inspection (or with the help of telescopes).
Then, photos of these land covers were recorded and field survey questionnaire
was filled in manually. Finally, Aowei Interactive Map was used to collect the
coordinate of these typical sampling points. The sampling points were strictly set as the center of a pure area
at least larger than 30 m ´ 30 m to ensure the purity.
Table 2 The land cover survey system in this study
|
Level 1
|
Level
2
|
Level
3
|
|
Forest
|
Coniferous
forest
|
Pure
coniferous forest
|
|
Mixed
coniferous forest
|
|
Broadleaf
forest
|
Pure
broadleaf forest
|
|
Mixed
broadleaf forest
|
|
Conifer-broadleaf
mixed forest
|
Conifer-broadleaf
mixed forest
|
|
Bamboo
|
Bamboo
|
|
Mangrove
|
Mangrove
|
|
Shrub
|
Shrub
|
Pure
shrub
|
|
Mixed
shrub
|
|
Grassland
|
Grassland
|
Grassland
|
|
Crop
|
Crop
|
Paddy
field crop
|
|
Non-paddy
field crop
|
|
Artificial
surface
|
Artificial
surface
|
Artificial
surface
|
|
Water
|
Water
|
Water
|
|
Bare
land
|
Bare
land
|
Bare
soil
|
|
Bare
rock
|
Table 3 The field survey questionnaire
|
Sample number
|
Longitude (E)
|
Latitude (N)
|
Level 3
|
Photo number
|
Sample description
|
|
ZZ20190729001
|
117??17¢33.618²
|
24??48¢17.101²
|
NPFC (Banana)
|
ZZ20190729001
|
Banana plantations
|
|
??
|
??
|
??
|
??
|
??
|
??
|
|
ZZ20190729087
|
117??15¢1.564²
|
25??17¢52.993²
|
PBF (Pomelo)
|
ZZ20190729087
|
Pomelo planting base
|
The
indoor inspection was conducted through Aowei Interactive Map, Google Earth and
ArcGIS. Firstly, longitude and latitude of all the sampling points were input
into ArcGIS and were digitized according to the questionnaire. Then, all the
sampling points were checked with photos, marks in Aowei Interactive Map and
Google Earth image to ensure that they were
strictly set as the center of a pure area at least larger than 30 m ´ 30 m. Wrong and repeated sampling points
were removed during the check. Finally, all the sampling points were
classified and sorted out according to Table 2 and were output in the formats
of .shp and .kmz.
4 Results
4.1 Data Composition
In situ dataset of land cover types in Fujian
province (2019) contains three levels of sampling points
data and sampling points are archived in three folders respectively. Data named
method, data description, data format, numbers of file
and data size are summarized in Table 4.
Table 4 Data composition of ??In situ
dataset of land cover types in Fujian province (2019)??
|
Data
type
|
Data
named method
|
Data
format
|
Number
of file
|
Data
size
|
|
Land
cover_Level 1
|
%Land
cover_Level 1??s name%.shp
%Land
cover_Level 1??s name%.kmz
|
.shp, .kmz
|
14
|
2.15 MB
|
|
Land
cover_Level 2
|
%Land
cover_Level 2??s name %.shp
%Land
cover_Level 2??s name %.kmz
|
.shp, .kmz
|
22
|
2.33 MB
|
|
Land
cover_Level 3
|
%Land
cover_Level 3??s name%.shp
%Land
cover_Level 3??s name%.kmz
|
.shp, .kmz
|
32
|
2.56 MB
|
|
Photos
|
%Land
cover name in English%.jpg
|
.jpg
|
18
|
32.0 MB
|
|
Description
of photos
|
Documentation
in English and Chinese.docx
|
.docx
|
1
|
17.5 KB
|
4.2 Data Results
A total
of 4,846 sampling points were collected and the land cover types were divided
into three levels. The statistics of forest type sampling points is shown in
Table 5, the statistics of non-forest type sampling points is shown in Table 6,
and the statistics of non-vegetation type sampling points is shown in Table 7.
The spatial distribution of the Level 1 sampling points is shown in Figure 1,
including 3,584 for forest, 256 for shrub, 35 for grassland, 368 for crop, 270
for artificial surface, 270 for water and 63 for bare land (Figure 1). The
spatial distribution of the Level 2 sampling points is shown in Figure 2,
including 1,221 for coniferous forest, 1,454 for broadleaf forest, 91 for
conifer-broadleaf mixed forest, 808 for bamboo and 10 for mangrove. Other land
cover type sampling points are same as the Level 1 (Figure 2). The spatial
distribution of the Level 3 sampling points is shown in Figure 3, including
1,057 for pure coniferous forest, 164 for mixed coniferous forest, 1,313 for
pure broadleaf forest, 141 for mixed broadleaf forest, 91 for conifer-broadleaf
mixed forest, 808 for bamboo, 10 for mangrove, 226 for pure shrub, 30 for mixed
shrub, 35 for grassland, 145 for paddy field crop, 223 for non-paddy field
crop, 270 for artificial surface, 270 for water, 32 for bare soil and 31 for
bare rock (Figure 3).
Table 5 The statistics of forest type sampling points
|
Level 1
|
Numbers
|
Level 2
|
Numbers
|
Level 3
|
Numbers
|
|
Forest
|
3,584
|
Coniferous forest
|
1,221
|
Pure coniferous forest
|
1,057
|
|
Mixed coniferous forest
|
164
|
|
Broadleaf forest
|
1,454
|
Pure broadleaf forest
|
1,313
|
|
Mixed broadleaf forest
|
141
|
|
Conifer-broadleaf mixed forest
|
91
|
Conifer-broadleaf mixed forest
|
91
|
|
Bamboo
|
808
|
Bamboo
|
808
|
|
Mangrove
|
10
|
Mangrove
|
10
|
Table 6 The statistics of non-forest type sampling points
|
Level 1
|
Numbers
|
Level 2
|
Numbers
|
Level
3
|
Numbers
|
|
Shrub
|
256
|
Shrub
|
256
|
Pure
shrub
|
226
|
|
Mixed
shrub
|
30
|
|
Grassland
|
35
|
Grassland
|
35
|
Grassland
|
35
|
|
Crop
|
368
|
Crop
|
368
|
Paddy
field crop
|
145
|
|
Non-paddy
field crop
|
223
|
Table 7 The statistics of non-vegetation type sampling points
|
Level 1
|
Numbers
|
Level 2
|
Numbers
|
Level 3
|
Numbers
|
|
Artificial surface
|
270
|
Artificial surface
|
270
|
Artificial surface
|
270
|
|
Water
|
270
|
Water
|
270
|
Water
|
270
|
|
Bare land
|
63
|
Bare land
|
63
|
Bare soil
|
32
|
|
Bare rock
|
31
|
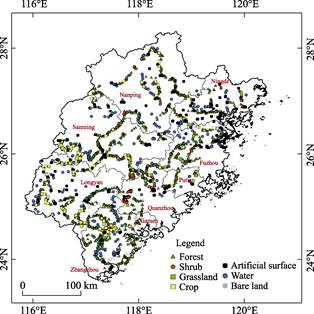
Figure 1 The spatial distribution of Level 1 sampling points
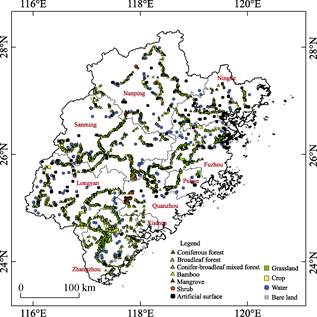
Figure 2 The spatial distribution of Level 2 sampling points
5 Discussion and Conclusion
Currently, fine land cover products are still lacking in Fujian province
due to the complexity of terrain and diversity of vegetation types. Instead,
most of research mainly focuses on the rough land cover scheme, small scale
area or the identification of single land cover type. At national and global
scale, land cover products have same problems of relatively rough land cover
scheme. Meanwhile, as the observed samples are limited, most global products
cannot guarantee the classification accuracy in a certain small area. In this
study, the substantial observed samples can be well used for mapping highly
accurate land cover products with a finer land cover scheme.
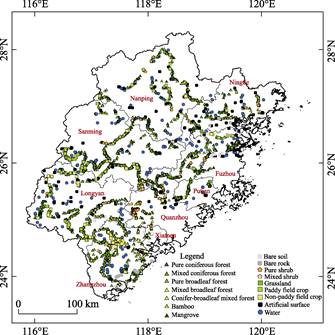
Figure 3 The spatial distribution of the Level 3 sampling points
Field
survey data is of fundamental importance to the validation of land cover
classification products. Given the huge challenge of accessing substantial
observed samples at global scale, sharing policy of field data becomes more and
more urgent[20]. The research
team of Professor Xiao, X. M. of University of Oklahoma, which has set up a
website platform for scholars to share their field photos
(http://eomf.ou.edu/), is publicly praised as a good example[21].
The sharing of field survey data can improve the utilization rate of data,
reduce the cost of related research, and promote the development of land cover
change research. Thus, we call on all the scholars to share their observed land
cover data in order to improve land cover products of large scale.
This
paper introduces the process and content of land cover survey in Fujian
province in 2019. Including 4,846 sampling points, the dataset basically covers
the entire land area. The land cover types were divided into three levels.
Users can choose an appropriate one according to their objectives. Through
public data-sharing, the dataset will promote the development of research on
land cover change and its processes, driving forces, as well as its ecological
and hydrological impacts and effects on this area.
Author Contributions
Chen, Y. L. and Lu, D. S. designed the dataset. Chen, Y.
L. and Huang, X. Y. contributed to the data processing. Liu, S. S., Lin, W. K., Peng, Z. W., Wu, Y. F., Pang, S. R. and
Zhao, S participated in the field survey. Chen, Y. L. and Huang, X. Y. wrote
the data paper.
Acknowledgements
The authors would like to thank undergraduates Xu, Y. Y.,
Kang, X. Y., Xiong, J. F., Lu, X, Fang, J. Y. and Zhou, W. X. for their support
in the field survey and indoor data processing.
References
[1]
Chen, J., Chen,
J., Gong, P., et al. Higher resolution global land cover mapping [J]. Geomatics
World, 2011, 9(2): 12-14.
[2]
Chen, Y. L.,
Luo, G. P., Maisupova, B., et al. Carbon budget from forest land use and
management in Central Asia during 1961?C2010 [J]. Agricultural & Forest Meteorology,
2016, 221: 131-141.
[3]
Chen, Y. L.,
Wang, S. S., Ren, Z. G., et al. Increased evapotranspiration from land
cover changes intensified water crisis in an arid river basin in northwest
China [J]. Journal of Hydrology, 2019, 574: 383-397.
[4]
Houghton,
R. A., House, J. I., Pongratz, J., et al. Carbon emissions from land use
and land-cover change [J]. Biogeosciences, 2012, 9(12): 5125-5142.
[5]
Sterling,
S. M., Ducharne, A., Polcher, J. The impact of global land-cover change on the
terrestrial water cycle [J]. Nature Climate Change, 2013, 3: 385-390.
[6]
Chen, Y. L.,
Lu, D. S., Moran, E., et al. Mapping croplands, cropping patterns, and
crop types using MODIS time-series data [J]. International Journal of
Applied Earth Observation and Geoinformation, 2018, 69: 133-147.
[7] Chen, Y. L., Zhao, S., Xie, Z. L., et al.
Mapping multiple tree species classes using a hierarchical procedure with
optimized node variables and thresholds based on high spatial resolution
satellite data [J]. GIScience &
Remote Sensing, 2020, 57: 526-542.
[8]
Lu, D. S.,
Batistella, M., Moran, E., et al. Fractional forest cover mapping in the
Brazilian Amazon with a combination of MODIS and TM images [J]. International
Journal of Remote Sensing, 2011, 32:, 7131-7149.
[9] Lu, D. S., Weng, Q. H. Use of impervious surface
in urban land-use classification [J]. Remote Sensing of Environment,
2006, 102: 146-160.
[10] Liu, J., Kuang, W., Zhang, Z., et al.
Spatiotemporal characteristics, patterns and causes of land use changes in
China since the late 1980s [J]. Journal of Geographical Sciences, 2014,
69(1): 3-14.
[11]
Mahmood,
R., Pielke, R. A., Hubbard, K. G., et al. Land cover changes and their
biogeophysical effects on climate [J]. International Journal of Climatology,
2014, 34: 929-953.
[12]
Yu, Z., Lu,
C. Q., Tian, H. Q., et al. Largely
underestimated carbon emission from land use and land cover change in the
conterminous US [J]. Global Change Biology, 2019, 25: 3741-3752.
[13]
Li, L.,
Jiang, D., Li, J., et al. Advances in hydrological response to land
use/land cover change [J]. Journal of Natural Resources, 2007, 22(2):
211-224.
[14]
Luo, G.,
Zhou, C., Chen, X. Process of land use/land cover change in the oasis of arid
region [J]. Journal of Geographical Sciences, 2003, 58(1): 63-72.
[15]
Yu, X.,
Yang, G., Wang, Y. Advances in researches on environmental effects of land
use/cover change [J]. Scientia Geographica Sinica, 2004, 24(5): 627-633.
[16]
Li, G. Y.,
Li, L. W., Lu, D. S., et al. Mapping impervious surface distribution in China using
multi-source remotely sensed data [J]. GIScience & Remote Sensing, 2020, 57: 543-552.
[17]
Gong, P. Accuracy
test on global land cover map based on the global flux observation station [J].
Progress in Natural Science, 2009, 19(1): 754-759.
[18]
Chen, Y.,
Huang, X., Lu, D., et al. In situ
dataset of land cover types in Fujian province (2019) [DB/OL]. Global Change
Data Repository, 2020. DOI: 10.3974/geodb.2020.04.02.V1.
[19]
GCdataPR Editorial Office. GCdataPR data sharing policy [OL]. DOI:
10.3974/dp.policy.2014.05 (Updated 2017).
[20]
Dong, J. W.,
Xiao, X. M., Sheldon, S., et al. Mapping tropical forests and rubber
plantations in complex landscapes by integrating PALSAR and MODIS imagery [J]. ISPRS
Journal of Photogrammetry and Remote Sensing, 2012, 74: 20-33.
[21]
Chen, B. Q.,
Li, X. P., Xiao, X. M., et al. Mapping tropical forests and deciduous
rubber plantations in Hainan Island, China by integrating PALSAR 25-m and
multi-temporal Landsat images [J]. International Journal of Applied Earth
Observation and Geoinformation, 2018, 50: 117-130.