Haiti Earthquake (2010) Remote Sensing
Analysis Datasets and Quick Response to
UN around Port-au-Prince
Liu, C.1 Guo, H. D.2 Lv, T. T.2* Wang, J. N.2 Liu, D. S.2 Wang, S. X.2
Gu, X. F.2 Qu, G. S.3
1. Institute of Geographic Sciences and Natural Resources Research, Chinese Academy of Sciences, Beijing 100101, China;
2. Institute of Remote Sensing and Digital Earth, Chinese Academy of Sciences, Beijing 100101, China;
3. National earthquake response support service, Beijing 100049, China
Abstract: The Haiti Earthquake (2010) Remote Sensing Analysis and Quick Response to UN datasets (HaitiEQ_2010data for short) was developed based on the GeoEye, QuickQird and BJ-1 data with high spatial resolution before and after the Haiti Earthquake at 21:53:10 (UTC) on January 12, 2010. The damaged buildings data, roads network data and the refugee camps distribution data are included in the HaitiEQ_2010d dataset. From the high resolution remote sensing data analysis, the quick responses analysis results were calculated, including 1,839 km roads, streets and paths data, 5,568 buildings or building groups damaged data with the area of 1,861,724.4 m2, 624 refugee camps of 691,623.44 m2 during the first week of the disaster. The dataset is archived in the .shp and .kmz data format with the data size of 2.5 MB. On February 2, 2012, the HaitiEQ_2010 datasets and related statistic report were submit to UN-SPIDER and UNPAN though the Global Alliance for Enhancing Access to & Application of Scientific Data in Developing Countries of UN GAID (e-SDDC) as a references for decision making.
Keywords: Haiti; earthquake; 2010; roads; damaged buildings
1 Introduction
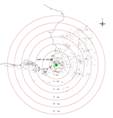
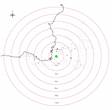
The Republic of Haiti occupies the western third of the island of Hispaniola, located in the NE Caribbean. On January 12, 2010, a very strong earthquake with a magnitude of 7.0 Mw struck Haiti at 21:53:10 (UTC).The USGS epicenter was 18.457°N, 72.533°W, approximately 25 km west of Port-au-Prince[1], Haiti’s capital (Figure 1). Because the depth of this earthquake was very shallow, the earthquake caused destructive damage in this most populated region in Haiti.
|
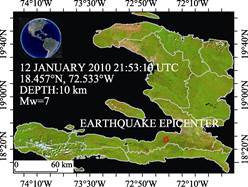
Figure 1 Location of the epicenter of 2010
Haiti earthquake
|
Soon after the earthquake, many countries and international organizations responded to appeals for humanitarian aid. The Interna-
tional Charter for Space and Major Disasters was activated. Many high-resolution optical satellite imageries covering the earthquake-hit region were acquired a few hours later after the disaster thankfully to the good weather condition.
The consultative project led by CAST and the Chinese Academy of Sciences was approved by UN GAID from 2007 to 2012, titled Global Alliance for Enhancing Access to & Application of Scientific Data in Developing Countries of UN GAID (e-SDDC). So after the disaster UN GAID e-SDDC immediately organized thirty-five experts in remote sensing field to produce damage maps in the disaster-struck area in order to offer decision-making reference for earthquake assessment. By using satellite data such as GeoEye (January 13, 2010 and January 16, 2010), Quick bird (January 10, 2010), BJ-1 (January 13, 2010) with spatial resolution ranging from 0.41m to 4m,detailed damage information such as damaged building was produced by comparing pre-earthquake satellite data to post-earthquake satellite data. Although many auto-
recognition techniques have been developed to detect damages, the visual interpretation
approach was adapted in this research due to its reliability. On February 2, 2012, the ARC/GIS datasets of damaged buildings, road network, refugee camps and related report were submit to UN-SPIDER and UNPAN by GAID e-SDDC. The event of HAITI Earthquake 2010 demonstrates the remote sensing technology with wide coverage, real-time and an unchallenged abilities to access precarious areas is a valuable post-earthquake damage assessment tool[2].
2 Metadata of Dataset
The descriptions of the HaitiEQ_2010data[3] are recorded. These information include the dataset full name, dataset short name, authors, geographical region of the dataset content, year of the dataset, number of the dataset tiles, dataset spatial and temporal resolution, dataset format and size, data publisher, and data sharing policy. Table 1 is the summary of the metadata of the HaitiEQ_2010data.
3 Methods
Based on satellite data including GeoEye (January 13, 2010, January 16, 2010), Quick Bird (January 10, 2010) and BJ-1 (January 13, 2010), the damaged buildings, roads, refugee camps were interpreted by comparing pre-earthquake satellite data with post-earthquake satellite data. Table 2 is the technical specification of using remotely sensed data. According
Table 1 Metadata Summary of the HaitiEQ_2010data
|
Items
|
Description
|
|
Dataset full name
|
Haiti earthquake (2010) remote sensing analysis and quick response to UN datasets
|
|
Dataset short name
|
HaitiEQ_2010data
|
|
Authors
|
Liu, C. L-3684-2016, Institute of Geographic Sciences and Natural Resources Research, Chinese Academy of Sciences, lchuang@radi.ac.cn
Guo, H. D. G-9388-2017,Institute of Remote sensing and Digital Earth, Chinese Academy of Sciences, hdguo@rad.ac.cn
Lv, T. T. R-8978-2016, Institute of Remote sensing and Digital Earth, Chinese Academy of Sciences, lvtt@radi.ac.cn
Wang, J. N. E-2431-2017, Institute of Remote sensing and Digital Earth, Chinese Academy of Sciences, jwang@radi.ac.cn
Liu, D. S. L-7432-2016, Institute of Remote sensing and Digital Earth, Chinese Academy of Sciences, dsliu@radi.ac.cn
Wang, S. X. Institute of Remote sensing and Digital Earth, Chinese Academy of Sciences, wsx@radi.ac.cn
Gu, X. F. L-7328-2016, Institute of Remote sensing and Digital Earth, Chinese Academy of Sciences, guxf@radi.ac.cn
Qu, G. S. National earthquake response support service, China
|
|
Geographical region
|
18.5°N-18.7°N, 72.2°W-72.47°W
|
|
Time
|
2010
|
|
Spatial resolution
|
1 m
|
|
Data format
|
.kmz, .shp, .zip
|
|
Data Size
|
2.5 MB
|
|
Data files
|
The dataset consists of 3 parts:
(1). HTI_Damaged_Building.zip, this is the ARC/GIS .shp compressed file of the collapsed building after the 2010 earthquake in Port-Au-Prince of Haiti. Data size is 441 KB
(2). HIT_Camp.zip??this is the ARC/GIS .shp compressed file of the refugee camps after the 2010 earthquake in Port-Au-Prince of Haiti. Data size is 66 KB
(3). HIT_Road.zip??this is the ARC/GIS .shp compressed file of the road in Port-Au-Prince of Haiti. Data size is 842 KB
|
|
Foundation(s)
|
Chinese Academy of Sciences (CXIOG-D04-03)
|
|
Data Publisher
|
Global Change Research Data Publishing & Repository, http://www.geodoi.ac.cn
|
|
Address
|
No.11A, Datun Road, Chaoyang District, Beijing 100101, China
|
|
Data Sharing Policy
|
The term of the Data from the Global Change Research Data Publishing and Repository is the definition of metadata, dataset (data product), and data paper (published through Journal of Global Change Data & Discovery). The Data sharing policy includes: (1) the Data is openly available and can be easily to be downloaded through internet for all; (2) end users are encouraged to use the Data subject to citation; (3) users, who are value added provider services, are welcome to redistribute the Data subject to written permission from the GCdataPR Editorial Office for the Data redistribution license; (4) for database or new dataset developers who use the Data to compile new dataset, the “ten per cent principal” should be followed, that is, the picked records from the Data should not surpass 10% of the new dataset, and the data records source should be clearly noticed in the suitable place in the new dataset[4]
|
to the image characteristics, namely color, spectra, texture, shape, morphological features of the object, remote sensing interpretation signs were established[5–6]. The interpreted results were cross-checked between different work groups. In order to reduce the differences of the resultcaused by persons training is performed. Interpretation criteria were made during the training. The detailed procedure of the HaitiEQ_2010[7] dataset after the 2010 earthquake in Port-Au-Prince of Haiti is shown in Figure 2.
Table 2 Technical specification of used remotely sensed data[7–8]
|
Satellite
|
Country
|
Company
|
Sensor
|
Spatial
resolution
|
Revisit cycle
|
Acquisition
time
|
Website
|
|
GeoEye-1
|
USA
|
GeoEye, Inc. Nasdaq
|
Panchromatic
Multispectral
|
0.41 m (Nadir)
1.65 m (Nadir)
|
3 days
|
Jan. 13, 2010,
Jan. 16, 2010
|
http://www.google.com/relief/haitiearthquake/ geoeye.html
|
|
Quick Bird
|
USA
|
DigitalGlobe
|
Panchromatic
Multispectral
|
0.61 m (Nadir)
2.44 m (Nadir)
|
1-6 days
|
Jan. 10, 2010,
|
ftp://ftp.digital global.com
|
|
BJ-1
|
China
|
Twenty First Century AerospaceTechnology Co., Ltd
|
Panchromatic
|
4 m (Nadir)
|
2-3 days
|
Jan. 13, 2010
|
|
| |
|
|
|
|
|
|
|
|
|
(1) Road (street, path) data development
According to the characteristics of road on remote sensing images with high spatial resolution, such as shape, grey and texture feature, roads in Port-Au-Prince of Haiti were extracted. Figure 3 is the road imagery in Port-Au-Prince of Haiti. From it we can see the road has uniform texture, and the contrast to background is obvious.
(2) Damaged buildings and building groups data development
Earthquake-induced building damage is one of the most critical threats to cities. The imaging features of collapsed or partial collapsed buildings are as followings:
A. The contour shape of the building disappears or be changed.
B. Texture and color of the collapsed or partial collapsed buildings have great difference with the pre-earthquake image.
C. There may be some deposits around the collapsed or partial collapsed buildings.
Figure 4 is the comparison of building before and after collapsed. From it we can see that the geometry and texture features of the collapsed building change greatly and there are a large number of deposits around the target. According to the criteria made in training the damaged buildings should be outlined according to its original footprint.
(3) Refugee camps data development
By comparing the images before and after the earthquake, we can find there are many high brightness and scattered small polygons as shown in Figure 5 occurred in many open areas after earthquake which are many refugee camps. According to the criteria made in training the refugee camps should be outlined according to its maximum spatial distribution.
|
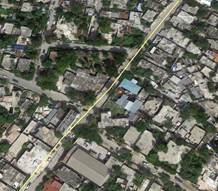
Figure 3 Imagery of road in Port-Au-Prince of Haiti
|
|
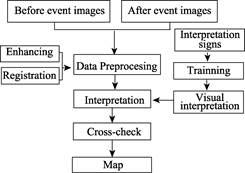
Figure 2 Procedure of HaitiEQ_2010 dataset
|
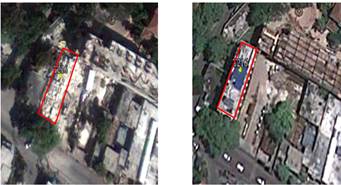
Figure 4 The comparison of building before and after collapsed
4 Data Products
|
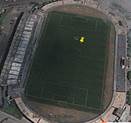 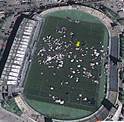
Figure 5 The comparison of refugee camps
before and after earthquake
|
4.1 Road (Street and Path) Data File
Figure 6 shows the mosaic of GeoEye-1 images of Haiti earthquake area on Jan. 13, 2010. Figure 7 shows the final result of road data in Port-Au-Prince of Haiti and total length is about 1,839 km.
4.2 Damaged Buildings and Building Groups Data File
Figure 8 is the interpreted result of damaged buildings in Port-Au-Pri nce of Haiti. Table 3 is the Statistics of damaged buildings. As shown in table 3, totally 5,568 damaged buildings or building groups were interpreted with the area about 1,861,724.4 m2.
4.3 Refugee Camps Data File
|
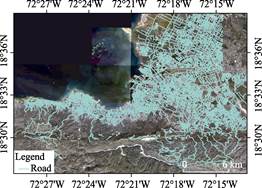
Figure 7 Road data in Port-Au-Prince of Haiti
in 2010
|
|
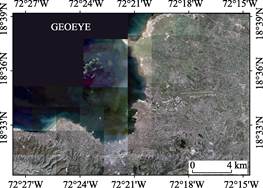
Figure 6 GeoEye-1 images of Haiti earthquake area on Jan. 13, 2010
|
Figure 9 shows the interpreted result of refugee camps in Port-Au-Prince of Haiti. As shown in Table 4, totally 624 damaged buildings were interpreted with the area about 691,623.44 m2 (Figure 9, Table 4).
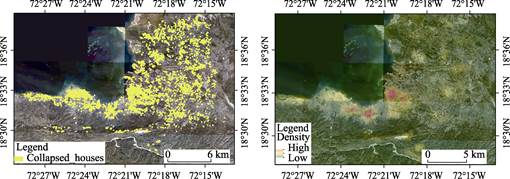
Figure 8 Spatial distribution and density of the damaged buildings in 2010 Haiti Earthquake
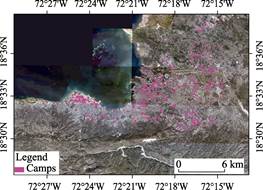
Figure 9 Refugee camp data in Port-Au-Prince of Haiti in 2010
Table 3 Statistics of damaged buildings
|
Buffer
|
Number
|
Area (m2)
|
|
|
<2 km
|
919
|
339,602.5
|
|
2–4 km
|
764
|
264,156.1
|
|
4–6 km
|
815
|
333,791.2
|
|
6–8 km
|
1,182
|
367,465.6
|
|
8–10 km
|
1,032
|
281,856.4
|
|
10–12 km
|
575
|
178,810.7
|
|
>12 km
|
281
|
96,041.92
|
|
Total
|
5,568
|
1,861,724.4
|
5 Discussion and Conclusion
After an earthquake effective and timely investigation of direct damages from disasters is very crucial. Remote sensing techniques were proved to be useful in detecting, identifying and monitoring the impact and effect of earthquake. Through acquiring, processing, interpreting and analyzing remote sensing data, the ARC/GIS datasets of damaged buildings, road network, refugee camps and related report on disaster were presented to UN-SPIDER and UNPAN by UN GAID e-SDDC within several days after the earthquake, which will provide help to them to make rapidly decisions on the routes for rescue and disaster relief dispatch.
Table 4 Statistics of refugee camp
|
Buffer
|
Number
|
Area (m2)
|
|
|
<2 km
|
46
|
142,103.47
|
|
2–4 km
|
70
|
243,372.7
|
|
4–6 km
|
77
|
143,603.5
|
|
6–8 km
|
176
|
101,499.9
|
|
8–10 km
|
177
|
34,584.49
|
|
10–12 km
|
58
|
23,258.15
|
|
>12 km
|
20
|
3,201.2
|
|
Total
|
624
|
691,623.44
|
Author Contributions
Liu, C. Guo, H. D. and Gu, X.F. designed the study, Lv, T. T., Wang, J. N., Liu, D. S., Wang, S. X. and Qu, G. S. finished the data processing and analysis. Lv, T. T. drafted the paper, Liu, C. finalized the paper and reviewed the dataset. Liu, C. submitted the dataset and paper (report) to UN-SPIDER and UNPAN.
Acknowledgement
Many thanks to GeoEye, Quickbird and Beijing Satellite for providing remote sensing images timely though internet. The authors of the paper access to the data above as earlier as January 13, 2010 for BJ-1, images, January 13-16, 2010 for GeoEye and January 10-16, 2010 for Quick bird remote sensing images.
References
[1] USGS Magnitude 7.0?DHAITI REGION [R]. http://earthquake.usgs.gov/earthquakes/recenteqsww/Quak es/us2010rja6.php.
[2] Li, P. Rapid Assessment of Bachu Earthquake based on Remote Sensing Technology in Xinjiang on February 24, 2003 [D]. Haerbin: Institute of engineering mechanics, China Earthquake administration, 2004.
[3] Liu, C., Guo, H. D., Lv, T. T., et al. Haiti earthquake (2010) remote sensing analysis and quick response to UN datasets [DB/OL]. Global Change Research Data Publishing & Repository, 2014. DOI: 10.3974/geodb.2014.02. 09.V1.
[4] GCdataPR Editorial Office. GCdataPR Data Sharing Policy [OL]. Global Change Research Data Publishing and Repository, 2014 (Updated 2017).
[5] Wang, R. X., Ye, L. Y. Quick Investigation of Seism Disaster Using Remote Sensing Technology [J]. Journal of Kunming University of science and technology (science and technology), 2003, 28(4):1-5
[6] Wang, Y. The application of remote sensing technology in seismic hazard assessment- taking the “5.12” Wenchuan earthquake as an example [D]. Shanghai: Tongji University, 2009.
[7] Geoeye-1 [DB/OL]. http://www.google.com/relief/haitiearthquake/geoeye.html.
[8] QuickBird [DB/OL]. ftp://ftp.digital global.com.