A Big-data-based Platform for Human-land Relations Analysis and Application in Urban Areas—The GSC Best Practice Data Computing Environment 2018
Xue, B.1,2* Li, J. Z.2,3 Xiao, X.1,2 Xie, X.1,2 Pang, M.1,2,4 Jiang, L.1,5
Lu, C. P.1,2 Ren, W. X.1,2
1. Key Lab of Pollution Ecology and Environmental Engineering, Institute of Applied Ecology, Chinese Academy of Sciences, Shenyang 110016, China;
2. Key Lab for Environmental Computation and Sustainability of Liaoning Province, Shenyang 110016, China; 3. College of Urban Planning and Architecture, Xuchang University, Xuchang 461000, China;
4. College of Geography and Environment Science, Northwest Normal University, Lanzhou 730070, China;
5. College of Earth and Environmental Sciences, Lanzhou University, Lanzhou 730000, China
Abstract: A big-data-based platform for human-land relations analysis and application in urban areas was recognized by the Geographical Society of China (GSC) as the GSC Best Practice Data Computing Environment 2018. The system was developed by calculating the spatial patterns of urban businesses and residences and relevant correlations based on electronic map POIs and web text data. GIS tools, such as the spatial kernel density estimation, were used to analyze the spatial aggregation patterns and correlations between human-land system elements. Based on these correlations, we established a data-computing platform. This platform provides a computing environment for the study of human-land relationships using big data. It also provides an experimental basis for innovating big data analysis methods and theoretical systems in the study of human-land relationships, and thus facilitates scientific discovery (human-land relationship) and decision-making.
Keywords: human-land relationship; computing environment; big data; urban area; point of interest
1 Background and Scientific Goals
Big data applications are rapidly evolving into a new generation of information technology and service industries that collect, store, and correlate large amounts of data from scattered sources in different formats and discover new knowledge, create new values, and enhance new capabilities[1–2]. The concept of geospatial big data is one of the key technical supports of ecological construction, ecological environment protection and regional sustainable development[3–4], and it is the core scientific and technological element supporting the development of smart cities and related geographic information industry[5–8]. With the rapid development of spatial information technology, computer technology, and network service, geospatial big data have gradually evolved from simple spatial coordinate information into a new type of geospatial data containing rich environmental semantic connotations[9–11], becoming a point of growth and research hotspot of emerging industries worldwide[12–14]. Geospatial big data have special characteristics. These characteristics reflect the breadth and depth of human-land system factors and are useful for extracting related information. Geospatial big data play an increasingly important role in popular applications such as the evaluation of public environmental policy, environmental monitoring analysis, and regional sustainable development[15–16]. The study on geospatial big data provides basic theoretical systems for constructing virtual ecosystems, especially in data support and spatial analysis. Geospatial big data, which is mainly represented by points of interest (POIs), is important for the study of human-land relationship because the data can represent economic activities and scope[17]. This is an empirical study in which POI data were used to explore spatial patterns and correlations among economic geography elements in order to apply geospatial big data to develop the layout of human-land elements and study the internal correlations among the elements in an innovative manner.
2 Data Sources
Taking 2017 as the base year, this study collected 433,700 POI data (18 categories) of all types of economic geography elements in Shenyang city, Liaoning province, China. The shopping service category had the most POI data, accounting for more than 31% of the total. Food services, daily life-related services, and companies and businesses’ POI data accounted for 40% of the total. The remaining types are: health care services; government agencies and social groups; science, education, and cultural services; transportation facilities and services, and automobile services. The POI data were based on the GCJ-02 Mars coordinate system. We obtained 1,279 unstructured data points for average house prices and house ages, based on web text crawling analysis.
3 Technical Roadmap and Algorithm
This study classified the POI data of Shenyang city according to national industry standards and used spatial statistics to extract urban spatial structure and aggregated characteristics of various industries and to explore the correlations between two types of spatial economic elements (Figure 1). Taking retail and housing as examples, we explored the spatial heterogeneity and impact mechanism of house prices based on the spatial correlations between the two (Figure 2). Calculation methods are as follows:
(1) Kernel density estimation (KDE) method[18]: The principle of KDE is to apply a kernel function to the center of each sample point i(x, y), and calculate the density contribution of each sample point (within the search radius range) to the center point of each grid cell. The closer the center point of the grid cell (within the search radius range) is to the sample point, the greater the density contribution of the sample point in this grid cell is. In this study, the retail POI kernel density map was superimposed onto the administrative division map to identify the areas where the retail stores’ kernel density value was significantly higher than that of the surrounding grids. These identified areas were defined as “retail business centers.”
(2) Spatial autocorrelation analysis[19]: It calculates a local spatial autocorrelation index based on a distance weight matrix, which can detect high-value and low-value aggregations. A high-value aggregation is called a hotspot, and a low-value aggregation is called a cold spot. We used this method to explore the spatial distribution of retail hotspots.
(3) Correlation analysis: The correlation coefficient is the basic indicator for measuring the strength of correlation between two variables. This study measured the spatial correlation characteristics of business services and urban residences by calculating the correlation coefficient between retail and residential kernel density in Shenyang city.
(4) Buffer analysis: Based on the POI data, a buffer with a certain width can be automatically created. In this study, 3 km was used as the maximum distance.
(5) Geographically weighted regression (GWR)[20]: By introducing geographic coordinate positions, the method extends the traditional regression model and can perform flexible local adjustment and weight optimization. Its model coefficients can reveal the spatial heterogeneity of geographic elements. This study used the GWR model to explore the impacts of various factors on house prices and the spatial heterogeneity of these factors.
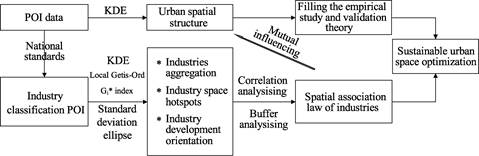
Figure 1 POI-based analysis and application of human-land relationship in urban areas
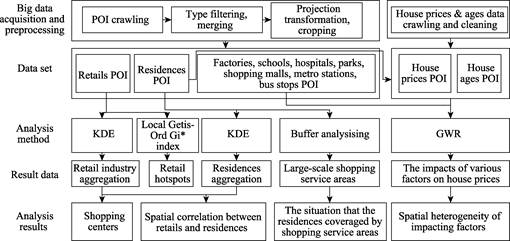
Figure 2 The framework of exploring the spatial correlations of urban economic geography elements
4 Main Applications and Results
|
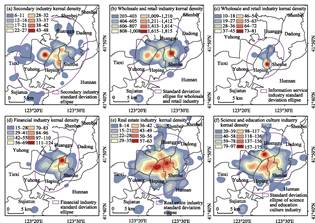
Figure 3 Distribution patterns of urban economic geography elements of different industries in Shenyang
|
The computing environment was established for analyzing urban economic activities in Shenyang city. Practically, combining the goal of the comprehensive revitalization of the old industrial base with the development status quo of industrial resource-based cities, we first constructed a multi-scale representation system of regional human-land systems and simulated the systems’ coupling evolutionary process. For data sources, we used big data combined with traditional data; for methods, we used modular analysis and systematical integration; for research design, we combined both theories and empirical evidence. This study fully reflects the multi-scale nesting and compounding of human-land systems and elements in the process of ecological reconstruction. Our study extends the traditional research from focusing on a single subject to include multiple subjects and contributes to enriching the scientific system of sustainable development. For example, the results show that the spatial mismatching characteristics of various industries are prominent in Shenyang. Some clusters are scattered in the peripheral urban areas, and the density of industrial aggregation exhibits circular diffusion (Figure 3). In addition, the study of spatial correlation between house prices and retail businesses on a micro scale (Figure 4) provides a detailed decision-making reference for governments, planning agencies, and homebuyers. At the same time, it tries to combine the policy-oriented scientific mechanism research with the local policy decision-making service to bridge the gap between science and policy.
|
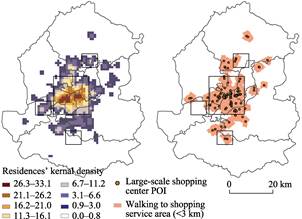
Figure 4 Comparison chart of residential kernel density and large-scale shopping service area in Shenyang city
|
5 Conclusion
This study analyzed the potential of big data application in human-land relationship research and established the levels of human-land relationship research, providing a reference for the future use of big data in human-land relationship research. It combined big data with GIS to quantitatively correlate and analyze retail and residential spatial aggregation characteristics and hotspot distribution, and explored the spatial heterogeneity of the effects of house price drivers in an old industrial region. This study helps the government and relevant departments to understand the supply and demand in the real estate market, monitor the development of the old industrial region while implementing the relocation and transformation policy, and promote the reconstruction and sustainable development of the old industrial region.
References
[1] People’s Daily. Xi Jinping’s report on the 19th National Congress of the Communist Party of China [OL]. http://cpc.people. com.cn/n1/2017/1028/c64094-29613660.html, 2017-10-28.
[2] Li, G. J., Cheng, X. Q. Research status and scientific thinking of big data [J]. Bulletin of Chinese Academy of Sciences, 2012, 27(6): 647-657.
[3] Wu, Z. F., Chai, Y. W., Dang, A. R., et al. Geography interact with big data: dialogue and reflection [J]. Geographical research, 2015, 34(12): 2207-2221.
[4] Li, D. R. Towards geo-spatial information science in big data era [J]. Acta Geodaetica et Cartographica Sinica, 2016, 45(4): 379-384.
[5] Ivan, I., Singleton, A., Horák, J., et al. The Rise of Big Spatial Data [M]. Switzerland: Springer International Publishing, 2016.
[6] Xie, X. A semantics-aware self-adaptive associated organization method of GeoVideo big data [J]. Acta Geodaetica et Cartographica Sinica, 2016, 45(10): 1260.
[7] Zhou, S. P., Xu, F. Thoughts for developing geographic information industry under big data [J]. Geomatics World, 2014, 21(1): 45-50.
[8] Liu, Y., Zhan, Z. H., Zhu, D., et al. Incorporating multi-source big geo-data to sense spatial heterogeneity patterns in an urban space [J]. Geomatics & Information Science of Wuhan University, 2018, 43(3): 327-335.
[9] Mckenzie, G., Janowicz, K., Gao, S., et al. How where is when? On the regional variability and resolution of geosocial temporal signatures for points of interest [J]. Computers Environment and Urban Systems, 2015, 54: 336-346.
[10] Gao, S., Janowicz, K., Couclelis, H. Extracting urban functional regions from points of interest and human activities on location-based social networks [J]. Transactions in GIS, 2017, 21(3): 446-467.
[11] Kunze, C., Hecht, R. Semantic enrichment of building data with volunteered geographic information to improve mappings of dwelling units and population [J]. Computers Environment and Urban Systems, 2015, 53: 4-18.
[12] Becker, R. A., Caceres, R., Hanson, K., et al. A tale of one city: using cellular network data for urban planning [J]. IEEE Pervasive Computing, 2011, 10(4): 18-26.
[13] Sagl, G., Resch, B., Hawelka, B., et al. From social sensor data to collective human behaviour patterns: analysing and visualising spatiotemporal dynamics in urban environments [C]. Proceedings of the GI-Forum 2012: Geovisualization, Society and Learning, 2012: 54-63.
[14] Li, D. Y. Location service in the big data era [J]. Science of Surveying and Mapping, 2014, 39(8): 3-6.
[15] Zhen, F., Qin, X., Xi, G. L. The innovation of geography and human geography in the information era [J]. Scientia Geographica Sinica, 2015, 35(1): 11-18.
[16] Long, Y., Liu, L. Four transformations of Chinese quantitative urban research in the new data environment [J]. Urban Planning International, 2017, 31(1): 64-73.
[17] Xue, B., Xiao, X., Li, J. Z., et al. POI-based analysis on retail’s spatial hot blocks at a city level: a case study of Shenyang, China [J]. Economic Geography, 2018, 38(5): 36-43.
[18] Wang, F. H. Quantitative Methods Applications in GIS [M]. Beijing: The Commercial Press, 2009.
[19] Ord, J. K., Getis, A. Local spatial autocorrelation statistics: distributional issues and an application [J]. Geograpical Analysis, 1995, 27(4): 286-306.
[20] Fotheringham, A. S., Brunsdon, C., Charlton, M. Geographically weighted regression: the analysis of spatially varying relationships [J]. American Journal of Agricultural Economics, 2004, 86(2): 554-556.