Content and Composition of Global Artificial Land Surface Dataset at 30 m Resolution (2010)
Chen, J.1 Liao, A. P.1 Chen, L. J.1* Zhang, H. W.1 He, C. Y.1 Peng, S.1
Wu, H.1 Zhang, W. W.1 Li, R.1 Zheng, X. Y.1 Mei, Y.1 Lu, M.1 Lu, N.1
Kang, R.1 Xing, H. Q.1 Liu, L. F.1, 2 Han, G.1, 2 Wang, J.2 Yang, A. L.3
Sun, L. M.3 Song H.3 Chen, W. P.4 Zhou, X. M.4 Xia, L.4 Jiang, H. B.5
Huo, J.5 Zhang, Y.5 Liu, W. D.5 Li, Y. X.5 Zhai, L.6 Sang, H. Y.6
1. National Geomatics Center of China, Beijing 100830, China;
2. Geo-Compass Geo-information Technology Company, Beijing 100048, China;
3. Heilongjiang Geomatics Center, National Administration of Surveying, Mapping and Geo-information of China, Harbin 150086, China;
4. The First Institute of Photogrammetry and Remote Sensing, National Administration of Surveying, Mapping and Geo-information of China, Xi’an 710054, China;
5. Sichuan Surveying and Mapping Institute of Remote Sensing Information, Chengdu 610100, China;
6. Chinese Academy of Surveying and Mapping, Beijing 100830, China
Abstract: Global Artificial Land Surface Dataset at 30 m Resolution (2010) is one of the ten co-verages of Global 30 m Resolution Datasets of Land coverage 2010, reflecting the dataset of the carrier for types of land use such as human settlements, industrial and mining, commercial and transportation areas and for human living place, operation space and engineering. The spatial distribution of artificial surface coverage types objectively reflects the resources allocation, industrial layout and economic conditions of human society. This paper deals with a dataset relying on the remote sensing mapping project of global land surface coverage, including USA’s earth resources technology satellite (Landsat) TM5, ETM+ multi-spectral image data of 9,907 Scenes and the multispectral image data of 2,640 Scenes from China's environment disaster mitigation satellite (HJ-1). In the process of land cover classification information extraction based on satellite remote sensing data, to identify types of artificial surface coverage as well as to extract their information is one of the most complicated jobs. Its main reason is that the artificial surface coverage mostly appears in the form of layouts such as composite pixels interlocking and interlacing and fragmentary scattering. Based on the diversity and complexity of spectrums and morphological characteristics reflected by the artificial surface coverage on the satellite remote sensing image, the research and development of Global 30 m Resolution Dataset of Artificial Surface Coverage 2010 are completed by comprehensively utilizing the existing classification technology to organically combine the pixel classifier, object segmentation and knowledge-based discrimination and by taking the POK (Pixel-Object-Knowledge) - based classification method. This data is obtained after the sampling inspection on some regions, all of which occupy a memory space of 8 GB. For convenient access and network sharing, data files in the dataset are organized by way of framing. Framing rules are defined as: framing as per 5° (latitude) × 6° (longitude) within the region from 60° SL to 60° NL, with a total of 674 sets of data files; framing as per 5° (latitude) × 12° (longitude) within the region from 60° NL to 80° NL (the Antarctic continent excluded), with a total of 76 sets of data files; projecting as per the central meridian of odd 6° zones. Global data is divided into 750 frames in total, namely forming 750 sets of data files, each of which contains 4 data files, and they are respectively: (1) an entity data file (Geo TIFF raster data format); (2) a coordinate information file (TIFF WORD format); (3) a classified elementary images map file, i.e., a vector layer file recording the scope per scene and acquisition time of elementary images used in the classification (Shape file format); and (4) a metadata file (XML format). In addition, the dataset includes an attachment data file, which lists data file name, corresponding geographic coordinates and zoning codes and other information included in 759 sets of data files. Global Change Research Data Publishing & Repository and Map World System will provide the open and public-welfare download service.
Keywords: global land cover; artificial surface coverage; 30 m resolution; POK method; remote sensing mapping
1 Introduction
Artificial surfaces mainly refer to land types like residence, industry and mining, business, traffic and so on, and they are the carriers of living area of humans, operation space and projects. Their spatial distribution reflects the resource allocation, industrial distribution and economic situation of human society, while their space-time changes reflect the effects of production and living of humans on resources and environment utilization, resources consumption and ecological system changes[1–2]. Therefore, understanding the spatial distribution of global artificial surfaces has important meanings for the ecological and environmental health diagnosis, rational development and utilization of resources, environment protection and sustainable development[3–6].
To meet the urgent demands of global changes research, China launched Global High Precision Remote Sensing Mapping Project in 2009[7–8]. This project has finished developing the global land surfaces coverage data product of 2010 at 30 m resolution (GlobeLand30-2010), mainly using 30 m satellite images, and using 250-m remote sensing images data as the complementary data. The dataset introduced in this paper is one of the ten layers in GlobeLand30-2010: the artificial surfaces product (GlobeLand30_ATS2010).
2 Metadata of Dataset
Metadata about the Global Artificial Land Surface Dataset at 30 m Resolution (GlobeLand30_ATS2010)[9] are listed in Table 1 and Table 2, including: dataset full name, short name, corresponding author, authors, geographic region, time, spatial resolution, publisher, data sharing platform, data policy, etc.
3 Methods
3.1 Definition of Terms
Artificial land surface refers to the earth surfaces after a series of artificial building activities, including towns and other kinds of resident places, industrial and mining areas, transportation facilities, etc., but excluding continuous green space and water body inside the construction land.
Table 1 List of GlobeLand30_ATS2010 dataset authors
|
No.
|
Name
|
Researcher ID
|
Work Unit
|
Contact Information
|
|
1
|
Chen, J.
|
C-7025-2017
|
National Geomatics Center of China
|
chenjun@nsdi.gov.cn
|
|
2
|
Liao, A. P.
|
C-7538-2017
|
National Geomatics Center of China
|
lap@nsdi.gov.cn
|
|
3
|
Chen, L. J.
|
L-4546-2016
|
National Geomatics Center of China
|
chenlj@nsdi.gov.cn
|
|
4
|
Zhang, H. W.
|
C-9720-2017
|
National Geomatics Center of China
|
zhhw@nsdi.gov.cn
|
|
5
|
He, C. Y.
|
C-9259-2017
|
National Geomatics Center of China
|
hechying@nsdi.gov.cn
|
|
6
|
Peng, S.
|
C-7357-2017
|
National Geomatics Center of China
|
pengshu@nsdi.gov.cn
|
|
7
|
Wu, H.
|
C-6761-2017
|
National Geomatics Center of China
|
wuhao@nsdi.gov.cn
|
|
8
|
Zhang, W. W.
|
C-8073-2017
|
National Geomatics Center of China
|
zww9820@126.com
|
|
9
|
Li, R.
|
C-6806-2017
|
National Geomatics Center of China
|
liran@nsdi.gov.cn
|
|
10
|
Zheng, X. Y.
|
C-6703-2017
|
National Geomatics Center of China
|
xinyan_zheng@nsdi.gov.cn
|
|
11
|
Mei, Y.
|
C-9249-2017
|
National Geomatics Center of China
|
meiyang81@163.com
|
|
12
|
Lu, M.
|
C-7372-2017
|
National Geomatics Center of China
|
lumiao0616@163.com
|
|
13
|
Lu, N.
|
C-6796-2017
|
National Geomatics Center of China
|
ln901105@163.com
|
|
14
|
Kang, R.
|
C-9208-2017
|
National Geomatics Center of China
|
295672415@qq.com
|
|
15
|
Xing, H. Q
|
C-6845-2017
|
National Geomatics Center of China
|
xinghuaqiao@126.com
|
|
16
|
Liu, L. F.
|
C-7320-2017
|
Geo-Compass Geoinformation Technology Company
|
liulf@nsdi.gov.cn
|
|
17
|
Han, G.
|
C-6835-2017
|
Geo-Compass Geoinformation Technology Company
|
hgbj0001@gmail.com
|
|
18
|
Wang, J.
|
C-7381-2017
|
Geo-Compass Geoinformation Technology Company
|
wangjingqzy@sina.com
|
|
19
|
Chen, W. P.
|
C-9743-2017
|
The First Institute of Photogrammetry and Remote Sensing, NASG
|
cwpsc@163.com
|
|
20
|
Zhou, X. M.
|
C-9441-2017
|
The First Institute of Photogrammetry and Remote Sensing, NASG
|
410426390@qq.com
|
|
21
|
Xia, L.
|
C-9417-2017
|
The First Institute of Photogrammetry and Remote Sensing, NASG
|
46103337@qq.com
|
|
22
|
Yang, A. L.
|
C-6817-2017
|
Heilongjiang Geoinformatics Center of NASG
|
172323001@qq.com
|
|
23
|
Sun, L. M.
|
C-7480-2017
|
Heilongjiang Geoinformatics Center of NASG
|
sunlm@hljbsm.gov.cn
|
|
24
|
Song, H.
|
C-7459-2017
|
Heilongjiang Geoinformatics Center of NASG
|
8465509@qq.com
|
|
25
|
Jiang, H. B.
|
C-9332-2017
|
Sichuan Surveying and Mapping Institute of Remote Sensing Information
|
scrsygy@sina.com
|
|
26
|
Huo, J.
|
C-7291-2017
|
Sichuan Surveying and Mapping Institute of Remote Sensing Information
|
scrsygy@sina.com
|
|
27
|
Zhang, Y.
|
C-9230-2017
|
Sichuan Surveying and Mapping Institute of Remote Sensing Information
|
zhangyanyan917@163.com
|
|
28
|
Liu, W. D.
|
C-8352-2017
|
Sichuan Surveying and Mapping Institute of Remote Sensing Information
|
308876585@qq.com
|
|
29
|
Li, Y. X.
|
C-8324-2017
|
Sichuan Surveying and Mapping Institute of Remote Sensing Information
|
20933167@qq.com
|
|
30
|
Zhai, L.
|
C-7364-2017
|
Chinese Academy of Surveying and Mapping
|
zhailiang@casm.ac.cn
|
|
31
|
Sang, H. Y.
|
C-8187-2017
|
Chinese Academy of Surveying and Mapping
|
sanghy@casm.ac.cn
|
Table 2 Metadata of GlobeLand30_ATS2010 dataset
|
Items
|
Description
|
|
Dataset full name
|
Global artificial land surface dataset at 30 m resolution (2010)
|
|
Dataset short name
|
GlobeLand30_ATS2010
|
|
Corresponding author
|
Chen, L. J. L-4546-2616, National Geomatics Center of China, chenlj@nsdi.gov.cn
|
|
Geographical region
|
Global land
|
|
Year
|
2010
|
|
Spatial resolution
|
30 m
|
|
Temporal resolution
|
One year
|
|
Data format
|
.rar, .tif, .tfw, .shp, .xml, .exl
|
|
Data files
|
The major parts of the dateset are 750 data file groups, each group includes 4 files (.tif .tfw .shp .xml). Besides, there are 750 Excel files corresponding to each data file group, providing information about file name, geographic location, and data frame organization
|
|
Data size
|
8 GB
|
|
Foundation(s)
|
Ministry of Science and Technology of P. R. China (2013AA122802, 2009AA12001, 2009AA122003); National Natural Science Foundation of China (41231172)
|
|
Data publisher
|
Global Change Research Data Publishing & Repository, http://www.geodoi.ac.cn
|
|
Address
|
No. 11A, Datun Road, Chaoyang District, Beijing 100101, China
|
|
Data sharing policy
|
Data from the Global Change Research Data Publishing & Repository includes metadata, datasets (data products), and publications (in this case, in the Journal of Global Change Data & Discovery). Data sharing policy includes: (1) Data are openly available and can be free downloaded via the Internet; (2) End users are encouraged to use Data subject to citation; (3) Users, who are by definition also value-added service providers, are welcome to redistribute Data subject to written permission from the GCdataPR Editorial Office and the issuance of a Data redistribution license; and (4) If Data are used to compile new datasets, the ‘ten per cent principal’ should be followed such that Data records utilized should not surpass 10% of the new dataset contents, while sources should be clearly noted in suitable places in the new dataset[10]
|
Most urban area covers resident places, roads, green spaces and water bodies, which is a mosaic structure. In this case, the water body belongs to the land surface waters type and the green space belongs to the forest or grassland, thus the artificial land surface only covers resident places and roads. The industrial and mining land use type includes open-cast mine area, salt field and auxiliary road and building facilities. The minimum mapping unit for planar pattern is 4×4 pixels. Linear pattern spots mainly include railways, highways and other lands for transportation, and the minimum mapping unit for linear pattern is 1×6 pixels.
3.2 Selection of Satellite Images
The satellite images used for development of the GlobeLand30_ATS2010 data are mainly 30 m multispectral images, as same as that for the GlobeLand30-2010, including Landsat TM5/ETM+ (9,907 scenes) and Chinese Huanjing satellite (HJ-1) (2,640 scenes).
3.3 Extraction of Artificial Land Surfaces Data
Considering the spectral and spatial diversity and complexity of various artificial land surfaces, a comprehensive approach, called POK-based (“pixel-object-knowledge”) approach, was developed. This method combines the pixel classifier, object segmentation, and knowledge-based interactive interpretation. The POK classification method has been
published in separate papers[8,11–13], its major part is illustrated in Fi-
gure 1, and briefly summarized in the following sections.
3.3.1 Object Segmentation Based on Geometric Forms and Characteristics
|
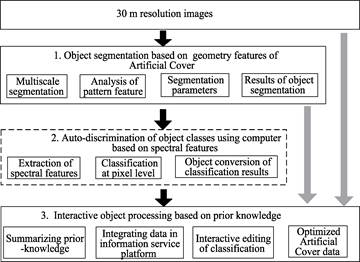
Figure 1 The extracting procedure of global artificial surfaces of
POK classification based object
|
The segmentation is conducted in e-Cognition software; the segmentation parameters were set to four levels (10, 20, 50 and 150) to reflect the characteristics of different artificial surfaces: continuous type, scattered type, and group type. Then, separate parameters were used according to four different levels to extract artificial surface types.
3.3.2 Object Classification Based on Spectral Characteristics
After object segmentation, every object was classified based on characteristics of spectrum and form. To facilitate the convenience and consistency of object classification in operational production, the POK method adopts the classification results combined with pixel levels to complete the automatic classification of segmented objects, i.e., transforming the pixel level classification results into the object level extraction results based on pixel level classification (Figure 2-Figure 6).
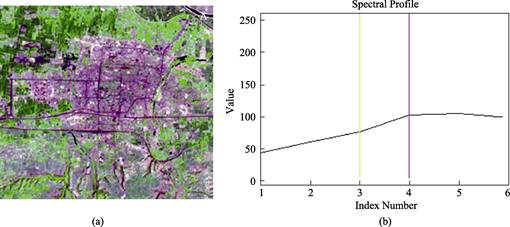
Figure 2 Urban: satellite image (a) and corresponding spectral features (b)
3.3.3 Interactive Object Processing Based on Prior Knowledge
Due to diverse characteristics of artificial land surfaces in the world, particularly in urban
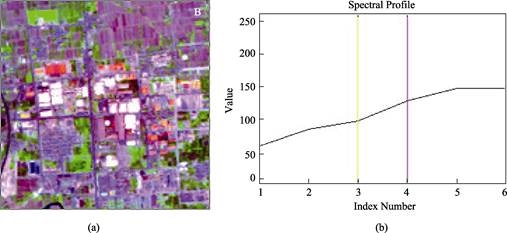
Figure 3 Large factories: satellite Image (a) and corresponding spectral features (b)
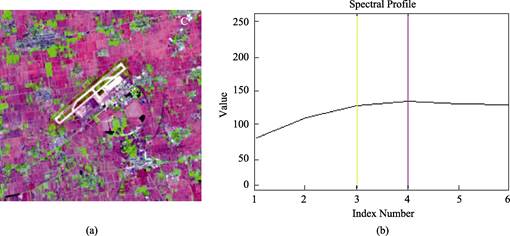
Figure 4 Airport: satellite image (a) and corresponding spectral characteristics (b)
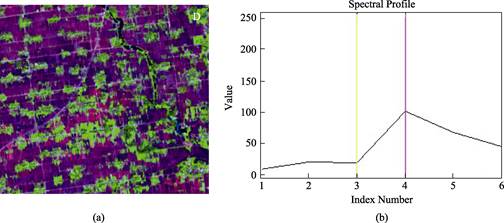
Figure 5 Village: satellite image (a) and corresponding spectral characteristics (b)
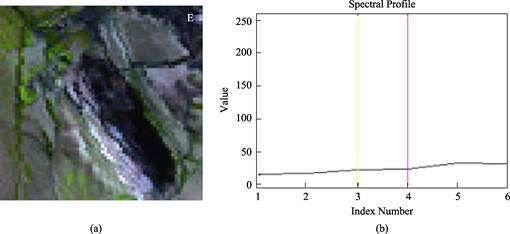
Figure 6 Open mine land: satellite image (a) and corresponding spectral characteristics (b)
areas, the POK method adopts the human-computer interaction in ArcMap environment. The prior-knowledge was used to identify and correct the classification errors resulted from previous automatic classification, according to the spatial distribution characteristics of artificial coverage.
4 Data Product
4.1 Spatial Distribution of Dataset
GlobeLand30_ATS2010 dataset covers global land area, and its spatial distribution is as shown in Figure 7.
4.2 Data Framing Organization
Two kinds of dataset framing mode were used to organize data files. A separate paper detailed the framing method[14]. Mainly including:
4.2.1 Framing Data of 5° (Latitude) × 6° (Longitude)
Within the range of 60° of north and south latitude, framing data is conducted as per 5° (latitude) × 6° (longitude) (Figure 8), and it totals 674 frames, i.e., 674 datasets.
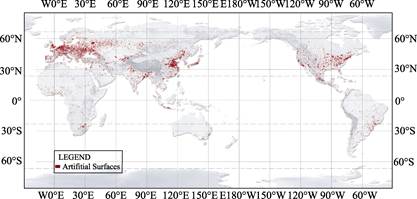
Figure 7 Spatial distribution of global artificial land surfaces in 2010
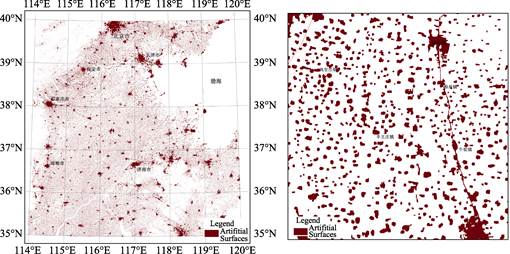
Figure 8 N50-35 subdivision schematic
4.2.2 Framing Data of 5° (Latitude) × 12° (Longitude)
Within the range from 60° to 80° of north and south latitude, framing as per 5° (latitude) × 12° (longitude) (Figure 9), and projection is conducted as per the central meridian of odd number 6° belts. It totals 76 frames, i.e., 76 datasets.
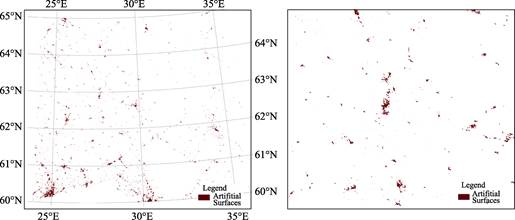
Figure 9 N35-60 subdivision schematic
GlobeLand30_ATS2010 dataset totals 750 frames (excluding the Antarctic). The frame cutting range should be the rectangular area formed by the minimum bounding rectangle of the four margin corner points of the frame extending by 7,500 meters (250 pixels)(Figure 9). All data files and their corresponding geographic coordinates are gathered in GlobeLand30_ATS2010.xlsx.
4.2.3 Naming Data Files
File name of framing data consists of 22 characters in a sequence of south and north latitude abbreviation (1 letter)+6° belt code(2 digits)+ “_” + the starting latitude of the lower left corner (2 digits)+ “_” +the year of the product (4 digits)+LC030(abbreviation of 30 meter resolution land cover)+ “_water”.
For example: N19_25_2010LC030 represents belt No.19, (in rectangular range of 108°-114° east longitude), and 25°-30° north latitude in 2010. For the frame crossing two 6°-belts, its central meridian shall be put as the one of the odd-number belt, and code put as the one of the odd-number belt; The starting latitude value shall be put as the latitude value of the bottom edge line for the northern hemisphere, and the top edge line for the southern hemisphere. Scope of data with the corresponding latitude and longitude range see table file GlobeLand30_ATS2010.xlsx.
4.3 Data Composition
4.3.1 Data Formats
The framing data of GlobeLand30_ATS2010 adopts compressed file package (.rar) for archiving and providing download service. For example: N19_25_2010LC030_ATS.rar, the compressed data amount of a single frame data file range from 100 KB to 40 MB, and total data amount is about 8 GB. The compressed package includes four files: the class file, coordinate information file, and metadata file. Among the files:
(1) Classification file: land surface classification, Geo-TIFF grille data format to store and 8 Bit 256 index color mode; the attribute value is 80.
(2) Coordinate information file: the coordinate information; TIFF WORD format.
(3) Index map file: the vector layer files of the range and the capture time of each scene of main images that are used by classification, shape file format.
(4) Metadata file: the metadata information of classification, .xml format.
4.3.2 Data File List
All data files, their corresponding coordinates’ collection, and UTM data bands are in the “GlobeLand30_ATS2010.xlsx” file (Table 3).
Table 3 Items of the list of data files (GlobeLand30_ATS2010.xlsx)
|
Serial No.
|
Name of Map Tile
|
Collection of Data Files
|
Data Files
|
UTM Band Number
|
Range of Latitude
|
Range of Longitude
|
|
1
|
N26_10
|
N26_10_2010LC030_ATS.rar
|
N26_10_2010LC030_ATS.tif,N26_10_2010LC030_ATS.tfw,N26_10_2010LC030_ATS.shp,N26_10_2010LC030_ATS.xml
|
26
|
10°N-15°N
|
30°W-24°W
|
|
2
|
N26_15
|
N26_15_2010LC030_ATS.rar
|
N26_15_2010LC030_ATS.tif, N26_15_2010LC030_ATS.tfw, N26_15_2010LC030_ATS.shp, N26_15_2010LC030_ATS.xml
|
26
|
15°N-20°N
|
30°W-24°W
|
|
…
|
...
|
…
|
…
|
...
|
...
|
...
|
|
750
|
S59_75
|
S59_75_2010LC030_ATS.rar
|
S59_75_2010LC030_ATS.tif, S59_75_2010LC030_ATS.tfw, S59_75_2010LC030_ATS.shp,S59_75_2010LC030_ATS.xml
|
59
|
75°S-80°S
|
168°E-180°E
|
5 Preliminary Data Accuracy Assessment
A two-level sampling model was used to ensure the objectivity of the accuracy evaluation on the artificial land surface classification. The first level was termed “frame sampling”, which takes “frame” as the sampling unit. The second level was called “element sampling”, at which we took “the spatial classification element in the frame” as the sampling unit to calculate the quantity of samples of each level that needs to be taken, then the samples were arranged by combining spatial variability analysis. 80 frames were taken at a global level, 4,269 samples were used to conduct a accuracy evaluation on the artificial surfaces product in 2010. The result showed that the dataset producer’s accuracy was 64.56%, and the users’accuracy was 86.97%. Figure 10 and Figure 11 were two examples.
|
Table 4 Statistics of global artificial land surface in 2010
|
|
Region
|
Area(104 km2)
|
Percentage (%)
|
|
Globe
|
118.75
|
100.00
|
|
Asia
|
41.41
|
34.87
|
|
Europe
|
32.42
|
27.30
|
|
Africa
|
7.82
|
6.59
|
|
North America
|
29.28
|
24.66
|
|
South America
|
6.04
|
5.09
|
|
Oceania
|
1.78
|
1.50
|
|
Note: Antarctica is excluded. In the data calculation process the value is rounded to eight decimal places, and the calculation results are rounded to two decimal places.
|
6 Statistics for Global Artificial Land Surface
6.1 Artificial Land Surface Distribution in Continents
The statistical results of GlobeLand30_ATS2010 in continents are listed at Table 4. The total area of the global artificial land surface is 1.187,5 million km2 in 2010, accounting for 0.88% of the global land surface. The percentages of artificial land surface in sequence: Asia (34.87%), Europe (27.30%), North America (24.66%), Africa (6.59%), South America (5.09%) and Oceania (1.50%). Asia, Europe, and North America accounted for 86.83% of that of the globe.
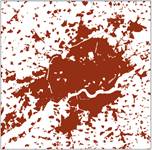
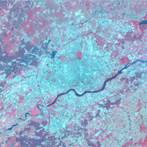
Figure 10 Comparison of extracted artificial land cover with satellite image, Shenyang, China
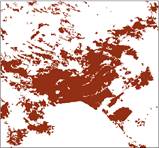
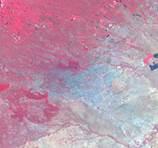
Figure 11 Comparison of extracted artificial land cover with satellite image, Nairobi, Kenya
6.2 Spatial Distribution of Global Artificial Land Surface
As can be seen from Figure 12, the spatial distribution of global artificial land surfaces is rather uneven. Observed from the latitude direction, 82.28% of the artificial land surface is distributed in the mid-latitude regions between 20°NL and 60°NL. The artificial land surface in the northern hemisphere accounts for 90.69% of that of the globe, of which all countries with larger artificial surface coverage area are distributed in the northern hemisphere, such as the United States, Canada, China, Russia, and India. The artificial surface area in the southern hemisphere accounts for only 9.31% of that of the globe, of which 97.39% of the artificial land surface coverage area in the southern hemisphere is distributed in the mid-latitude regions between 0°SL and 40°SL. Observed from the longitude direction, the artificial land surface coverage distribution in eastern and western hemispheres trends to more in the west (67.66%) and less in the east (32.34%). The artificial land surface coverage area in the eastern hemisphere is mainly distributed in regions between 60°E-140° E, accounting for 84.04% of that of the eastern hemisphere, while the artificial surface coverage area in the western hemisphere is mainly distributed in two regions between 50°W and 80°W and between 120°W and 180° W, accounting for 80.43% of that of the western hemisphere.
|
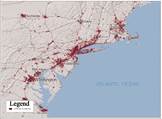 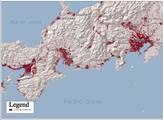 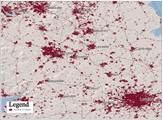
Figure 13 Atlantic coastal Figure 14 Tokaido urban land Figure 15 Artificial land
urban land (United States) (Japan) surface in southeast of UK
|
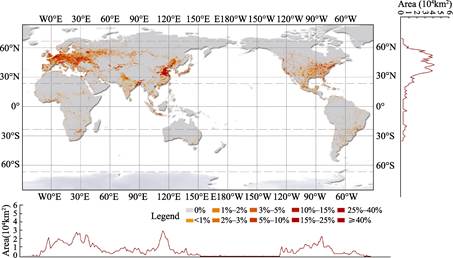
Figure 12 Artificial land surface density map of the world (2010)
6.3 Cases of the Artificial Land Surfaces
GlobeLand30_ATS2010 shows how the development of urbanization all over the world in 2010. The following subsets (Figure 13–Figure 17) demonstrate the spatial distribution of artificial surfaces in selected cases: Atlantic coast of northeastern United States; city clusters in Tokaido, Japan; city clusters in the southeast region of UK; Mexico City and its adjacent areas; and city clusters in the Yangtze River Delta of China.
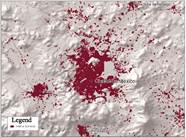
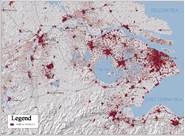
Figure 16 Mexico City (Mexico) Figure 17 Yangtze River Delta urban lands (China)
7 Discussion
There are still some problems in the present data product. One of the remarkable issues is the mixed pixels in urban and rural settlement classification. Settlements in small villages and sub-urban regions are frequently represented by mixed pixels at 30 m resolution, lead to misclassification of these features. Considering the large amount of small settlements, it is prohibitively expensive to improve the data quality by interactive approach. Therefore, the future work should focus on developing fully automatic algorithms tailored to various settlements over different eco-systems.
Global dataset of artificial land surface coverage at 30 m resolution provide the distribution of artificial land surfaces with finer scale all around the globe, are a good indicator of the impact of human activities on the earth surface. Further efforts will be still necessary in the future in terms of information extraction, precision validation and data improvement for subclass artificial surface information extraction.
Acknowledgements
The global 30 m resolution global artificial land surface dataset (2010) (GlobeLand30_AST2010) is a part of the 30 m resolution surface coverage data set (2010) (GlobeLand30-2010). Contributors are Academician Xu, G. H., Xu, D. M., Kurexi, John Townshend, Liao, X. H., Li, J. H., Zhang, S. M., Liu, J. Y., Li, P. D, Li, Z. G., Chen, X. J., Zhao, Y., Jiang, J., Hu, J. H., Song, Y. G., Barbara Rayin, Martin Herold, Ban, Y. F., Liu, C., Gu, X. F., Shi, R. X., Ioannis. Manakos, Maria A. Brocell, Linda See, Zhou, Q. M., Tang, P., Chen, J., Gong, P., Tong, X. H., Brice Mora, Georgios Sarantakos, Tobias Langanke, Paul Uhlir, Guo, H. D. et al. The detail contributions from each of the above experts had been described at the paper of Content and Composition of the Global Land Surface Water Dataset at 30 m Resolution (2010), which was published at the Journal of Global Change Data & Discovery, 2017, 1(1): 27-39. DOI: 10.3974/geodp.2017.01.05.
References
[1] Elvidge, C. D., Tuttle, B. T., Sutton, P. C., et al. Global distribution and density of constructed impervious surfaces [J]. Sensors, 2007, 7(9): 1962-1979.
[2] Kareiva, P., Watts, S., McDonald, R., et al. Domesticated nature: shaping landscapes and ecosystems for human welfare [J]. Science, 2007, 316(5833): 1866-1869.
[3] Hecht, A. D., Fiksel, J., Fulton, S. C., et al. Policy debate: creating the future we want [J]. Sustainability: Science, Practice, & Policy, 2012, 8(2): 182-221.
[4] Hoymann, J. Quantifying demand for built-up area?Da comparison of approaches and application to regions with stagnating population [J]. Journal of Land Use Science, 2012, 7(1):67-87. DOI: 10.1080/ 1747423X.2010.522600.
[5] Pereira, H. M., Wegmann, M. Essential biodiversity variables [J]. Science, 2013, 339(6117): 277-278.
[6] Verburg, P. H., Neumann, K., Nol, L. Challenges in using land use and land cover data for global change studies [J]. Global Change Biology, 2011, 17(2): 974-989. DOI:10.1111/j.1365-2486.2010.02307.x.
[7] Chen, J., Chen, J., Gong, P., et al. High resolution global land cover mapping [J]. Geomatics World, 2011, 9(2):12-14.
[8] Chen, J., Chen, J., Liao, A. P., et al. Concepts and key techniques for 30 m global land cover mapping [J]. Acta Geodaetica et Cartographica Sinica, 2014, 43(6): 551-557. DOI: 10.13485/j.cnki.11G2089.2014.0089.
[9] Chen, J., Liao, A. P., Chen, L. J., et al. The content and composition of Global Dataset of Artificial Surface Coverage at 30 m Resolution (2010) [DB/OL]. Global Change Research Data Publishing and Repository, 2014. DOI: 10.3974/geodb.2014.02.01.V1.
[10] GCdataPR Editorial Office. GCdataPR Data Sharing Policy [OL]. DOI: 10.3974/dp.policy.2014.05 (Updated 2017).
[11] Chen J., et al. Global land cover mapping at 30 m resolution: a POK-based operational approach [J]. ISPRS Journal of Photogrammetry and Remote Sensing, 2015, 103: 7-27. DOI: 10.1016/ j.isprsjprs.2014.09.002.
[12] Chen, J., Chen, L. J., Chen, J., et al??Preliminary research on global land cover mapping based on hierarchical classification using remote sensing [C]. Proceedings of the 18th China Symposium on Remote
Sensing, 2012: 626–636.
[13] Chen, L. J., Chen, J., Liao, A. P. Preliminary classification results for global land cover mapping at 30 meters resolution [J]??Bulletin of Surveying and Mapping, 2012 (sup):350-353.
[14] Chen, J., Liao, A. P., Chen, L. J., et al. Content and composition of the global land surface water dataset at 30 m resolution (2010) [J]. Journal of Global Change Data & Discovery, 2017, 1(1): 27-39. DOI: 10.3974/geodp.2017.01.05.