Monthly NPP Dataset Covering China’s Terrestrial Ecosystems at North of 18°N (1985–2015)
Chen, P. F.
State Key Laboratory of Resources and Environment Information System, Institute of Geographic Sciences and Natural Resources Research, Chinese Academy of Sciences, Beijing 100101, China
Abstract: The net primary productivity (NPP) of ecosystems is an important indicator of ecosystem vigor and a fundamental parameter for global climate change research. Therefore, the construction of a long-term NPP dataset is of great significance for ecosystem and global climate change research. To make the NPP product, national monthly meteorological data from 1985 to 2015, soil texture data, and land cover and vegetation index data products from moderate-resolution imaging spectroradiometer (MODIS) and Advanced Very High Resolution Radiometer (AVHRR) were collected, and then format and projection conversion and spatial scale matching were conducted to ensure that these data had the same scale. Finally, they were used as the input data for the Carnegie-Ames-Stanford Approach (CASA) model, and the NPP product was produced via the CASA model. The dataset includes 1 km raster data of monthly NPP in China’s terrestrial ecosystems north of 18°N from 1985 to 2015. Data are archived in .tif format with a data size of 28.2 GB.
Keywords: net primary productivity; monthly; kilometer grid; China’s terrestrial ecosystems; 1985–2015
1 Introduction
Long-term observations and a large number of studies have shown that the Earth’s climate system has undergone significant changes, both in the long-term historical period and in the period of existing instrumental observations over the past 100 years[1]. Changes in the climate system affect the structure and function of ecosystems. In addition, with the advancement of technology, humans are increasingly interacting with natural ecosystems. Ecosystem changes have been promoted by such interactions, especially recent projects involved in ecological environment restoration and social and economic development, e.g., returning farmland to forests and grasses, slope farmland reformation, oil and gas exploitation, urbanization and the construction of new rural regions[2]. Changes in ecosystems directly affect the life quality of human and even survival conditions. The net primary productivity (NPP) of ecosystems is an important indicator of ecosystem vigor and a fundamental parameter for global climate change research[3–6]. Estimating NPP at global and regional scales and studying its inter-annual and seasonal changes have been hotspots in the fields of international ecology and geosciences.
At the national scale, National Aeronautics and Space Administration (NASA) produces and delivers NPP products based on MODIS data. However, the data currently only cover the period after 2000. Because the effects of climate change and economic development on ecosystems are long-term processes, it is difficult for MODIS’s NPP products to meet the research needs. Thus, long-term NPP data are needed for researching the evolutionary discipline of ecosystems under the effects of climate change and human activities.
At present, the methods for estimating NPP can be divided into two main categories: the measured method and the model simulation method. The measured method comprises the harvest method, biomass investigation method and eddy covariance observation method[7]. Among these methods, the harvest and biomass investigation methods require destructive sampling. This type of sampling is not only time-costing and labor-consuming but also has a lack of data representativeness. The eddy covariance observation method does not require destructive sampling and can effectively estimate the carbon, water vapor and energy exchanges between atmospheric and terrestrial ecosystems. However, the monitoring range of this method extends from only hundreds of meters to 1 kilometer, depending on tower height. The model simulation method can be divided into the statistical model method, light energy use efficiency model method and ecosystem process model method[8]. The statistical model method, which is also called the climate potential model method, uses the empirical relationship between climatic factors and vegetation biomass to establish inversion models of NPP, such as the Miami model, Thornthwaite Memorial model, and Chikugo model. Compared statistical modeling, light energy use efficiency modeling and ecosystem process modeling are better at mechanistic interpretation. The ecosystem process model obtains NPP through simulations of physiological processes such as photosynthesis, the decomposition of organic matter, and the circulation of nutrient elements. It includes the BEPS model and BIOME-BGC model, etc. The light energy use efficiency model is based on the plant photosynthesis process and light energy use efficiency. The representative model contains the CASA model and the GLO-PEM model[8]. The above two types of models both have their own advantages and disadvantages. The ecosystem process model is more mechanistic than the light energy use efficiency model but involves too many input parameters, and some of these parameters are difficult to obtain accurately, which can bring errors to the estimation. The light energy use efficiency model simplifies plant physiological and ecological processes and directly uses remote sensing data as input parameters, which makes it relatively simple and easy to apply and popularize.
The CASA model is used to develop this dataset.
2 Metadata of Dataset
Metadata of the “Monthly NPP 1 km raster dataset of China’s terrestrial ecosystems (1985–2015)”[9] are summarized in Table 1. It includes the full name, short name, authors, year, temporal resolution, spatial resolution, data format, data size, data files, data publisher, and data sharing policy of the dataset.
Table 1 Metadata summary of “Monthly NPP 1 km raster dataset of China’s terrestrial ecosystems (1985–2015)”
|
Items
|
Description
|
|
Dataset full name
|
Monthly NPP 1 km raster dataset of China’s terrestrial ecosystems (1985–2015)
|
|
Dataset short name
|
ChinaNPP_1985_2015
|
|
Author
|
Chen, P. F. D-7136-2019, Institute of Geographic Sciences and Natural Resources Research, Chinese Academy of Sciences, pengfeichen@igsnrr.ac.cn
|
|
Geographical region
|
China Year 1985–2015
|
|
Temporal resolution
|
Monthly Spatial resolution 1 km
|
|
Data format
|
.tif Data size 28.2 GB (2.07 GB after compression)
|
|
Data files
|
The dataset contains 1,488 files. The first four digits of the file name are the year, and next digit is the month.
|
|
Foundations
|
Ministry of Science and Technology of P. R. China (2014FY210100); National Natural Science Foundation of China (41871344)
|
|
Data publisher
|
Global Change Research Data Publishing & Repository, http://www.geodoi.ac.cn
|
|
Address
|
No. 11A, Datun Road, Chaoyang District, Beijing 100101, China
|
|
Data sharing policy
|
Data from the Global Change Research Data Publishing & Repository includes metadata, datasets (data products), and publications (in this case, in the Journal of Global Change Data & Discovery). Data sharing policy includes: (1) Data are openly available and can be free downloaded via the Internet; (2) End users are encouraged to use Data subject to citation; (3) Users, who are by definition also value-added service providers, are welcome to redistribute Data subject to written permission from the GCdataPR Editorial Office and the issuance of a Data redistribution license; and (4) If Data are used to compile new datasets, the ‘ten percent principal’ should be followed such that Data records utilized should not surpass 10% of the new dataset contents, while sources should be clearly noted in suitable places in the new
dataset[10]
|
3 Methods
3.1 Algorithm Principle
NPP in the CASA model is calculated by Equation (1)[11]:
NPP(x, t) = APAR(x, t) × ε(x, t) (1)
where NPP(x, t) is the NPP at site x and time t (g C/m2); APAR (x, t) is the photosynthetically active radiation at site x and time t (MJ/m2); ε (x, t) is the light energy use efficiency at site x and time t.
3.1.1 Determination of Photosynthetically Active Radiation
The APAR absorbed is calculated by Equation (2):
PAR(x, t) = SOL(x, t) × FPAR(x, t) × 0.5 (2)
where SOL(x, t) is the total solar radiation at pixel x in month t (MJ/m2); FPAR(x, t) is the fraction of incident photosynthetically active radiation absorbed by vegetation; and the constant 0.5 indicates the proportion of solar radiation that can be utilized by vegetation.
3.1.2 Determination of the Photosynthetically Active Radiation Absorption Ratio
Referring to Potter et al.[11], the photosynthetically active radiation absorption ratio FPAR(x, t) is calculated in segmentation as follows:
(1) Based on the AVHRR NDVI from 1985 to February 2000, the following calculations are made:
R = (1+NDVI)/(1–NDVI) (3)
FPAR1(x, t) = [SR(x, t) – SRmin(x, t)]/[SRmax(x, t) – SRmin(x,t)] (4)
PAR(x, t) =min[FPAR1, 0.95] (5)
where SRmin(x, t) uses the value 1.08; SRmax(x, t) is related to the vegetation type and is determined according to the maximum NDVI of each vegetation type (arranging the NDVI values of all the pixels for a vegetation type in each month and each year from 1985 to 1994 from small to large values, the NDVI value at 95% is taken as the maximum NDVI value).
(2) After March 2000, FPAR is calculated by MODIS EVI using the following equations:
PAR1(x, t) =EVI(x, t) (6)
FPAR(x, t)=min[FPAR1, 0.95] (7)
3.1.3 Determination of Light Energy Use Efficiency
Light energy use efficiency ε(x, t) is calculated as follows:
ε(x, t) =Tε1(x, t) × Tε2(x, t) × Wε(x, t) × ε* (8)
|
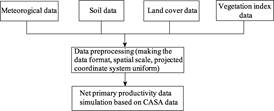
Figure 1 Technical route
|
where ε(x, t) is the light energy use efficiency; Tε1(x, t) and Tε2(x, t) are the effects of temperature on the conversion of light energy, and Wε(x, t) is the effect of water on the conversion of light energy. The detailed calculations of these variables are described in Potter et al.[12]. Referring to Potter et al.[12], the maximum light energy use efficiency ε* is set at 0.389 when calculating the NPP from 1985 to February 2000 using AVHRR data and is set at 0.55 when using MODIS data in other years.
3.2 Technical Route
The technical route is shown in Figure 1 and mainly includes two parts: data collection and preprocessing and data simulation.
3.2.1 Data Collection and Preprocessing
(1) Meteorological data
The meteorological data mainly include radiation, precipitation, and temperature. These data are from China’s regional high spatial and temporal resolution ground meteorological element driving dataset[13]. The dataset was downloaded from http://westdc.westgis.ac.cn/ and was developed by fusing observational data from weather stations in China with reanalyzed data from Princeton University, the Global Land Data Assimilation System (GLDAS), the National Aeronautics and Space Administration’s Global Energy and Water Cycle Experiment (NASA/GEWEX) surface radiation budget (SRB), and Tropical Rainfall Measuring Mission (TRMM) precipitation data. This dataset has a temporal resolution of 3 h and was used to calculate monthly temperature, precipitation, and radiation.
(2) Soil data
The soil data include information on soil texture types and clay and sand contents, and were derived from the China Soil Dataset based on the Harmonized World Soil Database (HWSD), version 1.1[14]. The dataset was made using HWSD data, which were developed by the Food and Agriculture Organization (FAO) of the United Nations and the Vienna International Institute of Applied Systems (IIASA). The data source in China is 1:1,000,000 soil data from a secondary national land survey provided by the Institute of Soil Science, Chinese Academy of Sciences. These data were downloaded from http://westdc.westgis.ac.cn/.
(3) Land cover data
Since the time scale of this research is relatively long, two sources of land cover data were used in this study. The land cover data from 1985 to 2000 were taken from the Advanced Very High Resolution Radiometer (AVHRR) land cover dataset, which was made based on AVHRR data from 1981 to 1994. The dataset was generated using the land cover classification system proposed by the Department of Geography of the University of Maryland (UMD) and downloaded from http://glcf.umd.edu/data/landcover/. As the Moderate Resolution Imaging Spectroradiometer (MODIS) provides land cover data from 2001, and the data have a higher temporal and spatial resolution than the AVHRR data. MODIS was used after 2000. The dataset was downloaded from http://reverb.echo.nasa.gov/. Although MODIS can provide data under five different classification systems, only data from the UMD classification system was used in order to be consistent with the AVHRR data.
(4) Vegetation index data
Two sources of vegetation index data were used in this study. AVHRR 3G NDVI data were used for the period from 1985 to February 2000 and were downloaded from https://ecocast.arc.nasa.gov/data/pub/gimms/. After March 2000, as MODIS can provide higher resolution data, vegetation index data product (MOD13A3) data downloaded from http://reverb.echo.nasa.gov/ were used.
(5) Data preprocessing
The collected data are not uniform in terms of data format, projected coordinate system, spatial resolution, and other factors. In the generation of NPP data, technologies such as data format and projected coordinate system conversion, data resampling and spatial registration were used to make the data have a uniform scale, namely, the Krasovsky_1940_Alberts projection system and a 1 km spatial resolution.
3.2.2 Data Simulation
|
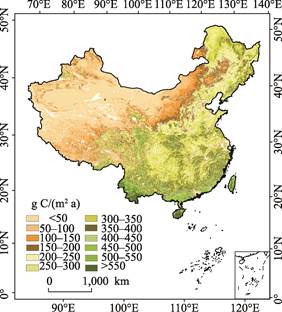
Figure 2 Spatial distribution of annual NPP of China’s terrestrial ecosystems at north of 18°N in 2010
|
Using the above preprocessed data as input, MATLAB software was used to compile the code and simulate NPP data using the CASA model.
4 Results and Validation
4.1 Results
Accumulated monthly data were used to produce the NPP for each year. The spatial distribution of NPP was nearly the same among different years. The distribution of NPP in 2010 is shown in Figure 2. Most of Hainan Island and southern Yunnan province had the highest annual NPP, with values above 550 g C/(m2 a). This may be due to the good rain and heat conditions in these places. The annual total NPP values of the southeastern part of the Qinghai-Tibet Plateau, the southern part of Guangdong and Guangxi provinces, the coastal areas of Fujian province, most of Taiwan Island and parts of the Qinling Mountains were 400–550 g C/(m2 a). These places are dominated by evergreen broad-leaved forests or deciduous broad-leaved forests. The NPP values for the Lesser and Greater Khingan Ranges, the Changbai Mountains, North China Plain, the northern part of Yunnan province, and most of Sichuan province were 200–400 g C/(m2 a). The NPP values of Sanjiang Plain, eastern Inner Mongolia province, and parts of northern Xinjiang province were 100–200 g C/(m2 a). These places are mainly covered by grassland and farmland. Other places, such as western Inner Mongolia, southern Xinjiang province and western Gansu province, had annual NPP values below 100 g C/(m2 a). In addition, the total NPP of China’s terrestrial ecosystems varies within a year. Total NPP began to increase gradually from an monthly average of 29×1012 g C in January, reached a maximum monthly average of 376×1012 g C in July, and then fell back to the low monthly average of 33×1012 g C in December.
4.2 Validation
Due to the limited sampling of measured data, it is often difficult to spatially match measured data with simulated data that are based on remote sensing. Thus, the problem caused by the scale effect makes it difficult to verify NPP simulation data[8]. At present, there are generally two methods to verify model-simulated NPP: comparison of the simulated NPP with measured data or with other model estimates[15–16]. In the present study, the generated NPP data are compared with measured and model simulation data from published articles for accuracy analysis.
Based on the CASA model, the annual NPP of China’s terrestrial ecosystems from 1985 to 2015 was 1.69–2.16 Pg C/a (1 Pg=1×10¹⁵ g). Compared with existing research, the NPP estimated in this study is within the normal fluctuation range (Table 1). The measured NPP and model-simulated NPP from references are listed in Table 2. In the present study, the simulated annual NPP of the evergreen coniferous forest ecosystem was 245–538 g C/(m2 a), the annual NPP of the evergreen broad-leaved forest ecosystem was 484–711 g C/(m2 a), the annual NPP of the deciduous coniferous forest ecosystem was 136–276 g C/(m2 a), the
Table 1 Total net primary productivity of China simulated by different models[17]
|
Methods
|
Year
|
NPP (Pg C/a)
|
Reference
|
|
Miami
|
1992
|
3.719
|
Sun and Zhu [17]
|
|
LUE
|
1992
|
2.645
|
Sun and Zhu[18]
|
|
CASA
|
1982–1992
|
1.5–2.1
|
Pu et al.[19]
|
|
LUE
|
1990
|
6.13
|
Chen et al.[20]
|
|
CEVSE
|
1981–1998
|
2.86–3.37
|
Cao et al.[21]
|
|
CASA
|
1982-1999
|
1.44
|
Fang et al.[22]
|
|
BEPS
|
2001
|
2.24
|
Feng et al.[23]
|
|
CASA
|
1989–1993
|
3.12
|
Zhu et al.[24]
|
|
GLOPEM
|
1981–2000
|
2.76–3.31
|
Gao and Liu[25]
|
|
CEVSA
|
1980-2000
|
3.13–3.68
|
Gao and Liu[25]
|
|
GEOPRO
|
2000
|
2.42
|
Gao and Liu[25]
|
|
GEOLUE
|
2000–2004
|
2.84
|
Gao and Liu[25]
|
|
LPJ
|
1981–1998
|
2.91–3.37
|
Sun[26]
|
|
M-SDGVM
|
1981–2000
|
3.30
|
Mao et al.[27]
|
|
BEPS
|
2000–2010
|
2.63–2.84
|
Liu et al.[15]
|
|
CASA
|
2001–2010
|
2.25–2.62
|
Pei et al.[28]
|
annual NPP of the mixed forest ecosystem was 164–378 g C/(m2 a), the annual NPP of the grassland ecosystem was 159–250 g C/(m2 a), and the annual NPP of the farmland ecosystem was 223–324 g C/(m2 a). These values all agree well with existing studies, indicating that the NPP generated by the present study has a good accuracy.
Table 2 Comparison of the net primary productivity of each vegetation type in the dataset with measured values and other simulation results (g C/(m2 a))
|
Methods
|
Vegetation type
|
|
Evergreen needle
|
Evergreen broad-leaved forest
|
Deciduous coniferous forest
|
Deciduous broad-leaved forest
|
Mixed forest
|
Farmland
|
Grassland
|
Year
|
Spatial scale
|
Range
|
|
Measured value
|
179–806[24],
219–1,550[29]
|
407–1,913[24],
692–1,540[29],
|
179–824[24],
258–855[29]
|
114–1,669[24],
273–827[29]
|
257–
1,098[24]
|
239–
760[30]
|
231[24],
29.5–
772[31]
|
|
|
|
|
BEPS[15]
|
553
|
810
|
385
|
641
|
517
|
584
|
110
|
2000–
2010
|
0.5 km
|
Nation wide
|
|
CASA[19]
|
354
|
525
|
432
|
304
|
330
|
216
|
154
|
1997
|
0.04°
|
Nation wide
|
|
CASA*[24]
|
367
|
986
|
439
|
643
|
|
427
|
103–507
|
1989–
1993
|
8 km
|
Nation wide
|
|
This study
|
245–538
|
484–711
|
136–276
|
163–420
|
164–378
|
223–324
|
159–250
|
1985–
2015
|
1 km
|
Nation wide
|
*indicates that the model has been modified.
5 Conclusion
By collecting and synthesizing meteorological, soil, land cover, and vegetation index data, this study used relative theory and algorithms to make a long time sequence of NPP of China’s terrestrial ecosystems. The dataset has a 1 km spatial resolution, a monthly temporal resolution, and a time range from 1985 to 2015. This dataset has a longer time scale and higher spatial and temporal resolution than previous analogous datasets. The dataset can be used for studies on topics such as the effect of climate change on China or regional ecosystems, the effect of national or local policies on ecosystems, and national or regional biocapacity research.
References
[1] Xiong, W. Simulation of main food crops production under future climate change scenarios in China [D]. Beijing: China Agriculture University, 2004.
[2] Lv, Y. H., Fu, B. J., Feng, X. M., et al. A policy-driven large scale ecological restoration: quantifying ecosystem services changes in the Loess plateau of China [J]. Plos One, 2012, 7(2): e31782.
[3] Jia, X. X., Shao, M. G., Wei, X. R., et al. Estimating total net primary productivity of managed grasslands by a state-space modeling approach in a small catchment on the Loess Plateau, China [J]. Geoderma, 2011, 160: 281–291.
[4] Xu, X. B., Tan, Y., Yang, G. S., et al. Impacts of China’s Three Gorges Dam project on net primary productivity in the reservoir area [J]. Science of the Total Environment, 2011, 409: 4656–4662.
[5] Gao, Y. H., Zhou, X., Wang Q., et al. Vegetation net primary productivity and its response to climate change during 2001-2008 in the Tibetan plateau [J]. Science of the Total Environment, 2013, 444: 356–362.
[6] Yuan, Q. Z., Wu, S. H., Zhao, D. S., et al. Modeling net primary productivity of the terrestrial ecosystem in China from 1961 to 2005 [J]. Journal of geographical Science, 2014, 24(1): 3–17.
[7] Sun, J. W., Guan, D. X., Wu, J. B., et al. Research advances in net primary productivity of terrestrial vegetation [J]. World Forestry Research, 2012, 25(1): 1–6.
[8] Zhang, D. L., Prince, S., Wright R. Terrestrial net primary production estimates for 0.5° grid cells from field observations—a contribution to global biogeochemical modeling [J]. Global Change Biology, 2003, 9(1): 46–64.
[9] Chen, P. F. Monthly NPP 1 km raster dataset of China’s terrestrial ecosystems (1985–2015) [DB/OL]. Global Change Research Data Publishing & Repository, 2019. DOI: 10.3974/geodb.2019.03.02.V1.
[10] GCdataPR Editorial Office. GCdataPR data sharing policy [OL]. DOI: 10.3974/dp.policy.2014.05 (Updated 2017).
[11] Potter, C. S., Randerson, J. T., Field, C. B., et al. Terrestrial ecosystem production: A process model based on global satellite and surface data [J]. Global Biogeochemical Cycles, 1993, 7(4): 811–841.
[12] Potter, C., Gross, P., Genovese, V., et al. Net primary productivity of forest stands in New Hampshire estimated from Landsat and MODIS satellite data [J]. Carbon Balance and Management, 2007, 2: 9.
[13] He, J., Yang, K. China meteorological forcing dataset [Z]. Cold and Arid Regions Science Data Center at Lanzhou, 2011. DOI: 10.3972/westdc.002.2014.db.
[14] Fischer, G., Nachtergaele, F., Prieler, S., et al. Global agro-ecological zones assessment for agriculture (GAEZ 2008). IIASA, Laxenburg, Austria and FAO, Rome, Italy, 2008.
[15] Liu, Y. B., Jv, W. M., He, H. L., et al. Changes of net primary productivity in China during recent 11 years detected using an ecological model driven by MODIS data [J]. Frontiers of Earth Science, 2013, 7(1): 112–127.
[16] Xie, B. N., Qin, Z. F., Wang, Y., et al. Spatial and temporal variation in terrestrial net primary productivity on Chinese Loess Plateau and its influential factors[J]. Transactions of the Chinese Society of Agricultural Engineering, 2014, 30(11): 244–253.
[17] Sun, R., Zhu, Q. J. Distribution and Seasonal Change of Net Primary Productivity in China from April, 1992 to March, 1993 [J]. Acta Geographica Sinica, 2000, 55(1): 36–45.
[18] Sun, R., Zhu, Q. J. Effect of climate change of terrestrial net primary productivity in China [J]. Journal of Remote Sensing, 2001, 5(1): 58–61.
[19] Piao, S. L., Fang, J. Y., Guo, Q. H. Application of CASA model to the estimation of Chinese terrestrial net primary productivity [J]. Acta Phytoecologica Sinica, 2001, 25(5): 603–608.
[20] Chen, L. J., Liu, G. H., Li, H. G. Estimating net primary productivity of terrestrial vegetation in China using remote sensing [J]. Journal of Remote Sensing, 2002, 6(2): 1993–2002.
[21] Cao, M. K., Tao, B., Li, K. R., et al. Interannual variation in terrestrial ecosystem carbon fluxes in China from 1981 to 1998 [J]. Acta Botanica Sinica, 2003, 45(5): 552–560.
[22] Fang, J. Y., Piao, S. L., Field, C. B., et al. Increasing net primary production in China from 1982 to 1999 [J]. Frontiers in Ecology and the Environment, 2003, 1(6): 293–297.
[23] Feng, X., Liu, G., Chen, J. M., et al. Net primary productivity of China’s terrestrial ecosystems from a process model driven by remote sensing [J]. Journal of Environmental Management, 2007, 85(3): 563–573.
[24] Zhu, W. Q., Pan, Y. Z., Zhang, J. S. Estimation of net primary productivity of Chinese terrestrial vegetation based on remote sensing [J]. Acta Geographica Sinica, 2007, 31(3): 413–424.
[25] Gao, Z. Q., Liu, J. Y. Comparative study on net primary productivity of vegetation in China [J]. Chinese Science Bulletin, 2008, 53(3): 317–326.
[26] Sun, G. D. Simulation of potential vegetation distribution and estimation of carbon flux in China from 1981 to 1998 with LPJ Dynamic Global Vegetation Model [J]. Climatic and Environmental Research, 2009, 14(4): 341–351.
[27] Mao, J. F., Dan, L., Wang, B., et al. Simulation and evaluation of terrestrial ecosystem NPP with M-SDGVM over continental China [J]. Advances in Atmospheric Sciences, 2010, 27(2): 427–442.
[28] Pei, F. S., Li, X., Liu, X. P., et al. Assessing the impacts of droughts on net primary productivity in China [J]. Journal of Environmental Management, 2013, 114: 362–371.
[29] Liang, W., Yang, Y. T., Fan, D. M., et al. Analysis of spatial and temporal patterns of net primary production and their climate controls in China from 1982 to 2010 [J]. Agricultural and Forest Meteorology, 2015, 204: 22–36.
[30] Song, F. Q., Kang, M. Y., Chen, Y. R., et al. Estimation of vegetation net primary productivity on North Shanxi Loess Plateau [J]. Chinese Journal of Ecology, 2009, 28(11): 2311–2318.
[31] Cheng, J. Response of grassland vegetations distribution to climate change in loess plateau [D]. Yangling: Northwest Agriculture Forestry University, 2011.