Time Series of Land Surface Phenology Dataset in
Central Asia (1982?C2015)
Ma, Y. G. Liu,
S. H.*
College of Resource and Environment Sciences, Xinjiang
University, Urumqi 830046, China
Abstract: Central Asia
(30??N?C60??N, 50??E?C100??E) is one of the arid and semi-arid regions of the world.
It is extremely important to understand the response of surface vegetation to
climate change under water stress. Based on a Global Inventory Monitoring and
Modeling System (GIMMS) ndvi3g.v1 data, the threshold-based and inflexion-based
methods were used to extract surface phenology data in Central Asia from 1982
to 2015. The spatial reference system was a geographic coordinate system at a
spatial resolution of 0.083,3?? (about 8 km). The dataset consisted of two
groups of data files: Group V1 and Group V2. The processing of the Group V1
data file was as follows. First, the NDVI data were filtered and reconstructed
by a double logistic function, and then the start of season (SOS), end of
season (EOS), and length of season (LOS) were calculated by a 20% dynamic
threshold method. The Group V2 data file was developed by reconstructing the
NDVI time series data using a series of piece wise logistic functions, and then
the SOS, EOS, and LOS were calculated by the inflexion-based method. The
dataset was archived in .hdr, .img and .tif formats in 408 data files, with a
data size of 126 MB (compressed to 75.6 MB in one file).
Keywords: land surface
phenology; remote sensing; Central Asia; 1982?C2015
1 Introduction
Vegetation phenology is widely collected, summarized, and
analyzed to determine the characteristics and trends of historical climate
change [1]. The vegetation information can be used as an
intermediate parameter in scientific simulations and the calculation of
regional and even Earth system energy and material transfers[2?C3].
Land surface phenology
data is relatively limited. Vegetation phenological data sources can be divided
into in-situ observations, remote
sensing phenology, and phenology observations based on digital camera or
unmanned aerial vehicle (UAV) data. The three observation methods have their
own advantages and disadvantages. For the remote sensing phenology method,
vegetation phenological information is determined by extracting characteristic
values from the growth curve. This method can obtain phenological information
data at the landscape or regional scale, but there are scale differences with
human observation data, which need to be verified carefully[4].
Digital cameras and UAVs use modern technology to measure phenology. With finer
scale, but it is difficult to generate long-time series data. It is therefore
mainly used for the cross validation and multi-scale analysis of alternative
human observation phenology data and remote sensing phenology[5‒7].
Central Asia is one of
the world??s typical arid and semi-arid regions. Vegetation phenology studies in
this region could further our understanding of the response mechanism of plant
phenology to climate change under water stress. the GIMMS ndvi3g.v1 data is the
longest time span vegetation data currently available. The threshold and
inflection point methods were applied to this dataset to extract a phenological
dataset for the start of season (SOS), end of season (EOS), and length of season
(LOS) in Central Asia from 1982 to 2015.
2 Metadata of the Dataset
The
metadata of the ??Time series of land surface phenology dataset in Central Asia
(1982?C2015)??[8] are shown in Table 1.
Table 1
Metadata summary of ??Time series of
land surface phenology dataset in Central Asia (1982?C2015)??
|
Items
|
Description
|
|
Dataset
full name
|
Time series of land surface phenology dataset in Central
Asia (1982?C2015)
|
|
Dataset
short name
|
LSP_CA
|
|
Authors
|
Ma, Y. G. AAH-5322-2019, College of Resource and
Environment Sciences, Xinjiang University, mayg@xju.edu.cn
|
|
|
Liu, S. H. AAB-2538-2020, College of Resource and
Environment Sciences, Xinjiang University, liush@bnu.edu.cn
|
|
Geographical
region
|
30??N?C60??N, 50??E?C100??E Year 1982?C2015
|
|
Temporal
resolution
|
Year Spatial
resolution 0.083,3?? (about
8 km)
|
|
Data
format
|
.img, .tif, .hdr Data
size 126 MB (75.6 MB, after
compression)
|
|
Data
files
|
408 data files in two folders are compressed into one file
(1) The V1 folder contains the SOS, EOS, and LOS extracted
by the threshold method. There are 204 files in total, including 102 .img
data and 102 .hdr files
(2) The V2 folder contains the SOS, EOS, and LOS extracted
by the inflexion method. There are 204 files in total, including 102 .img
data and 102 .hdr files
|
|
Foundations
|
Ministry of Science and Technology of
P. R. China (2017YEF0118100); National Natural Science Foundation of China
(41761013, 41861053); Department of Education of the Xinjiang Uygur
Autonomous Region (XJEDU2017M007)
|
|
Computing
environment
|
Matlab 2014b
|
|
Data
publisher
|
Global Change Research Data Publishing & Repository, http://www.geodoi.ac.cn
|
|
Address
|
No. 11A, Datun Road, Chaoyang District, Beijing 100101,
China
|
|
Data
sharing policy
|
Data from
the Global Change Research Data Publishing & Repository includes metadata,
datasets (data products), and publications (in this case, in the Journal of Global Change Data &
Discovery). Data sharing policy
includes: (1) Data are openly available and can be free downloaded via the
Internet; (2) End users are encouraged to use Data subject to citation;
(3) Users, who are by definition also value-added service providers, are welcome
to redistribute Data subject to written permission from the GCdataPR Editorial
Office and the issuance of a Data redistribution license; and (4) If Data
are used to compile new datasets, the ??ten percent principal?? should be
followed such that Data records utilized should not
surpass 10% of the new dataset contents, while sources should be clearly
noted in suitable places in the new dataset[9]
|
|
Communication
and
searchable
system
|
DOI, DCI, CSCD, WDS/ISC, GEOSS, China GEOSS, Crossref
|
3 Methods
3.1 Algorithm Principle
The GIMMS ndvi3g.v1 data was first fitted with logical
functions and reconstructed:
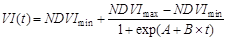 (1)
(1)
where NDVImax
is the maximum NDVI, NDVImin
is the minimum NDVI, t is the Julian
day (d), VI(t) is the NDVI value at day t
after fitting, and A and B are fitting parameters. The difference between NDVImax and NDVImin is the amplitude of
the vegetation growth curve.
(1)
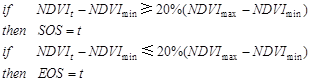
Dynamic threshold method[10]
When
the NDVI value of Julian day t is
greater than or equal to an amplitude of 20%, t is regarded as the SOS, and when the NDVI value of Julian day t is less than or equal to the amplitude
of 20%, t is regarded as the EOS.
 (2)
(2)
(2) Inflection point method[11]
The
curvature is calculated as follows:
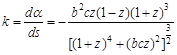 (3)
(3)
 (4)
(4)
The
rate of change of curvature is:
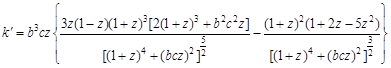 (5)
(5)
By
calculating the local extremum of the rate of change of the curvature, the
position of the inflection point can be determined, thereby determining the SOS
and EOS.
3.2 Technical
Route
The dataset was developed by pre-processing the GIMMS
ndvi3g.v1 data, obtaining the NDVI time series data for Central Asia from 1982
to 2015, and then obtaining the plant growth fitting curves of each grid
through logical function fitting. The threshold method and the inflection point
method were used to extract two phenological datasets, which included the three
phenological parameters of SOS, EOS, and LOS. Finally, data integration was performed
to complete the LSP_CA Central Asia region.
4 Results and
Validation
4.1 Data Composition
The ??Time series of land surface phenology dataset in Central
Asia (1982?C2015)?? includes SOS, EOS, and LOS data that were derived by two
phenological extraction methods, i.e., the
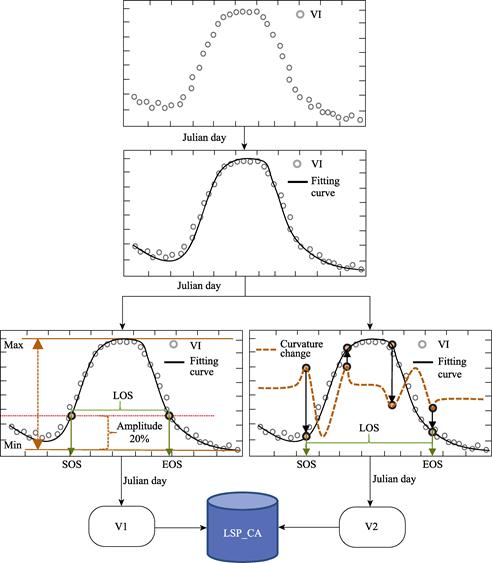
Figure 1 Technical route of the dataset
development
threshold and inflection methods.
Data description, data format, number of files, and the amount of data are
shown in Table 2.
(1) Data header file (.hdr). Contains all
header file information of the corresponding raster data, including data type,
number of rows and columns, and projection information.
(2) Phenological raster data. The SOS, EOS, and LOS extracted
by the threshold method are LOG_20% _SOSyyyy.img, LOG_20% _EOSyyyy.img, and
LOG_20% _LOSyyyy.img. The SOS, EOS, and LOS obtained by the inflection point
method are LOG_inflexion_ SOSyyyy.tif, LOG_inflexion_EOSyyyy.tif, and
LOG_inflexion_LOSyyyy.tif. Here yyyy represents the four-digit year, and each
phenological raster data has a corresponding data header file (.hdr), which can
be operated in ENVI software. For import and export, the raster data value
represents the corresponding Julian day time of the corresponding phenological
parameter of the year; the invalid value is 0; and the spatial coordinate
system is the latitude and longitude as geographic coordinates.
Table 2 List of files in the ??Time series of land
surface phenology dataset in Central Asia (1982?C2015)??
|
Composition file
|
Naming method
|
Description
|
Format
|
Number of files
|
Data size
|
|
Header file
|
Consistent with phenological raster data
|
Number of rows and columns, data type, spatial reference
system
|
.hdr
|
204
|
132.3
KB
|
|
Phenological raster data
|
LOG_20%_SOSyyyy.img
|
SOS obtained by threshold method
|
.img
|
34
|
28 MB
|
|
LOG_20%_EOSyyyy.img
|
EOS obtained by threshold method
|
.img
|
34
|
28 MB
|
|
LOG_20%_LOSyyyy.img
|
LOS obtained by threshold method
|
.img
|
34
|
28 MB
|
|
LOG_inflexion_SOSyyyy.tif
|
SOS obtained by inflection method
|
.tif
|
34
|
14.1 MB
|
|
LOG_inflexion_EOSyyyy.tif
|
EOS obtained by inflection method
|
.tif
|
34
|
14.1 MB
|
|
LOG_inflexion_LOSyyyy.tif
|
LOS obtained by inflection method
|
.tif
|
34
|
14.1 MB
|
4.2 Results
Figure 2 shows partial images of the phenological parameters
obtained by the threshold and inflection point methods. It was found that the
SOS, EOS and LOS extracted by the threshold method reflected the spatial
distribution throughout the entire Central Asian region, and the results using
the threshold method were smoother than those obtained using the inflection
point method This was largely due to the obvious fluctuations of the NDVI data
at the beginning of the growth curve, which in turn led to large changes in the
rate of curvature change and poor spatial smoothness.
4.3 Data Analysis
The temporal change of phenological data is the focus of
phenological research. To analyze the time
trend characteristics of the two sets of data in this region, a Mann-Kendall
trend test[12] was applied to analyze the phenological data
obtained by the two methods in the 34-year period of the dataset (Table 3).
The
results obtained by the two methods showed that changes in the SOS, EOS and LOS
for about 73%?C85% of Central Asia were not significant over the 34-year period,
but there were advances detected in the SOS in 15% of the area investigated.
There was a significant advancing trend, but the results of the two methods were
not consistent for the analysis of the EOS. The use of the two methods produced
the opposite results for the change in the LOS. The results of the threshold
method showed that the LOS had shortened in 7.3% of the area but had increased
in 18.8% of the area. The inflection point method indicated that the LOS was
longer in more than 21% of the area investigated, while it had shortened in
only 3.5% of the area.
There
is currently only limited phenological data available for Central Asia. The
only publicly released data are two datasets of the global MCD12Q2 (versions
005 and 006), which were developed using MODIS data. Version 005 mainly uses
the inflection point method for data calculation, while version 006 mainly uses
the threshold method calculation. Compared with MCD12Q2 data, the new dataset
developed in the present study has a higher time resolution and is more
suitable for the long-term change analysis of large-scale mean surface area;
however, because this data has a coarse spatial resolution, it is more
susceptible to surface heterogeneity than MCD12Q2 data. Due to the influence of
surface heterogeneity, large errors may occur in areas with a diverse range of
surface cover types or that are strongly affected by human interference.
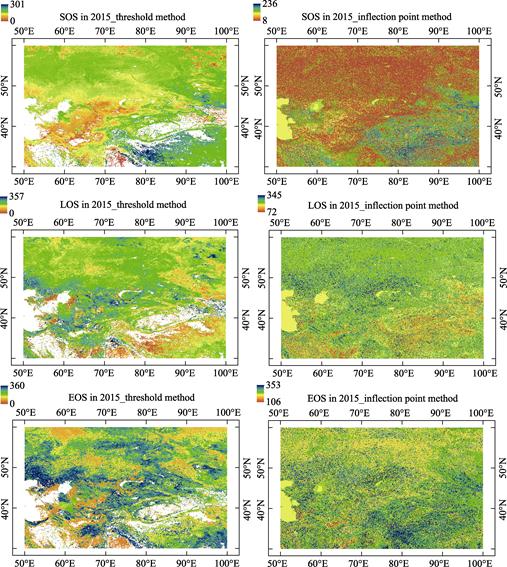
Figure 2 Spatial distribution of SOS, EOS, and LOS
of the dataset
Table
3 Change of the land land surface phenology among 34
years (198?C2015) (%)
|
Classification
|
Threshold
method
|
Inflection
point method
|
|
SOS
|
EOS
|
LOS
|
SOS
|
EOS
|
LOS
|
|
Very significantly advanced (shortened)
|
9.65
|
4.47
|
3.43
|
6.81
|
1.77
|
11.38
|
|
Significantly advanced (shortened)
|
7.80
|
4.43
|
3.91
|
9.22
|
1.39
|
9.79
|
|
Not significant
|
74.50
|
77.95
|
73.86
|
80.47
|
85.68
|
75.36
|
|
Significantly delayed (extended)
|
3.80
|
6.45
|
8.12
|
2.19
|
5.93
|
2.23
|
|
Very significantly delayed (extended)
|
4.25
|
6.71
|
10.68
|
1.32
|
3.84
|
1.24
|
5 Discussion and Conclusion
The 34-year-old land surface phenology
database developed in this dataset will be useful for researchers working on
regional climate change and surface plant ecosystem monitoring. However, the
phenology parameter set based on
GIMMS ndvi3g.v1 data has a coarse spatial
resolution of 8 km, which is certain to be affected by the problem of spatial
heterogeneity. The accuracy of the data cannot be accurately evaluated from the
perspective of manual observations. Through field inspections, areas could be
selected in parts of Central Asia with a high surface consistency and long-term
unchanged ground cover types. The collection of field observation data in these
areas would lead to a greater accuracy of this dataset. In addition, the use of
other phenological datasets, such as MCD12Q2 products, or the development of
new phenological product datasets based on long-term mid-resolution remote
sensing time series data, such as Landsat and sentries, is the next stage of
this work. This new dataset can identify the phenological changes at the
spatiotemporal scale, but it is susceptible to the influence and interference
of changes in surface cover types. Before using this data for further analysis,
the use of historical land use cover data, such as MCD12Q1, to remove the
impact of different land cover types will improve the reliability of the
research outputs.
Author
Contributions
Liu, S. H. designed the algorithms of the dataset and
evaluated the data. Ma, Y. G. contributed to the design of the research
framework, data processing, data analysis, and writing of the data paper. Liu,
S. H. reviewed the paper.
References
[1]
Chuine, I.,
Yiou, P., Viovy, N., et al.
Historical phenology: grape ripening as a past climate indicator [J]. Nature, 2004, 432(7015): 289‒290.
[2]
Migliavacca,
M., Sonnentag, O., Keenan, T. F., et al. On the uncertainty of phenological responses
to climate change, and implications for a terrestrial biosphere model [J]. Biogeosciences, 2012, 9(6): 2063.
[3]
Randerson,
J. T., Hoffman, F. M., Thornton, P. E., et
al. Systematic assessment of terrestrial biogeochemistry in coupled
climate-carbon models [J]. Global Change
Biology, 2009, 15(10): 2462‒2484.
[4]
Cleland, E.,
Chuine, I., Menzel, A., et al.
Shifting plant phenology in response to global change [J]. Trends in Ecology & Evolution,
2007, 22(7): 357‒365.
[5]
Nagai, S.,
Ichie, T., Yoneyama, A., et al.
Usability of time-lapse digital camera images to detect characteristics of tree
phenology in a tropical rainforest [J]. Ecological
Informatics, 2016, 32: 91‒106.
[6]
Vrieling, A.,
Meroni, M., Darvishzadeh, R., et al.
Vegetation phenology from Sentinel-2 and field cameras for a Dutch barrier
island [J]. Remote Sensing of Environment,
2018, 215(15): 517?C529.
[7]
Zhang, X.,
Jayavelu, S., Liu, L., et al.
Evaluation of land surface phenology from VIIRS data using time series of
PhenoCam imagery [J]. Agricultural and
Forest Meteorology, 2018, 256‒257: 137‒149.
[8]
MA, Y. G.,
Liu, S. H. Time series of land surface phenology dataset in Central Asia
(1982‒2015) [DB/OL]. Global Change Data Repository, 2020. DOI: 10.3974/ geodb.2020.01.05.V1.
[9]
GCdataPR Editorial Office. GCdataPR data sharing policy [OL]. DOI:
10.3974/dp.policy.2014.05 (Updated 2017).
[10]
Jonsson, P.,
Eklundh, L. Seasonality extraction by function fitting to time-series of
satellite sensor data [J]. IEEE
Transactions on Geoscience and Remote Sensing, 2002, 40(8): 1824‒1832.
[11]
Zhang, X., Friedl,
M. A., Schaaf, C. B., et al.
Monitoring vegetation phenology using MODIS [J]. Remote Sensing of Environment, 2003, 84(3): 471‒475.
[12]
McLeod, A. I.
Kendall rank correlation and Mann-Kendall trend test [Z]. R Package ??Kendall??, 2005.
http://www.stats.uwo.ca/faculty/aim.