Dataset of Effects of ENSO on the Annual
Rainfall Erosivity in Shaoguan city of Guangdong province (1951-2013)
Chen, S. F.
College of Tourism and Geography,
Shaoguan University, Shaoguan 512005, Guangdong, China
Abstract: The monthly rainfall erosivity of Shaoguan
city from 1951 to 2013 was calculated using the rainfall erosivity model with
the monthly rainfall data of the city. Sea Surface Temperature (SST) anomaly,
Southern Oscillation Index, and Multivariate El Niño?CSouthern Oscillation Index were used as El
Niño?CSouthern
Oscillation (ENSO) indices. The effect of ENSO on the monthly rainfall
erosivity was analyzed, and the ENSO dataset on the annual rainfall erosivity
of Shaoguan city from 1951 to 2013 was obtained. Results showed that the interannual
and intraannual variations in rainfall erosivity in Shaoguan city were large,
and the overall trend was fluctuating first and then increasing. Rainfall
erosivity was significantly correlated with SST anomaly. The collected data are
shown in Table 1?C2.
Table 1 presents the data of rainfall erosivity and erosivity anomaly in Shaoguan
city from 1951 to 2013. Table 2 shows the monthly ENSO index and rainfall
erosivity data of Shaoguan city from 1951 to 2013. The dataset is stored in
.xlsx format with 116 KB data volume. The results of the analysis of the
dataset are published in Scientia Geographica Sinica, Vol. 36, No. 10, 2016.
Keywords: rainfall erosivity;
ENSO; MEI; Shaoguan; 1951?C2013; Scientia
Geographica Sinica
1 Introduction
Rainfall is the direct cause and an important
factor of soil erosion. The ability of rainfall to induce soil erosion is known
as rainfall erosivity[1], which reflects the potential influence of
rainfall on soil to some extent[2?C3]. Rainfall erosivity is the
total rainfall kinetic energy E for 30 min and the product of the maximum
rainfall intensity I30; EI30 is the indicator of rainfall
erosivity and applied to the (revised) universal soil loss equation
(USLE/RUSLE) in the calculation of rainfall erosivity, that is, the R value of
rainfall erosivity[4?C6]. Scholars have conducted many studies on
rainfall erosivity and its application, and different rainfall erosivity
formulas have been established in different regions of the world under
different rainfall durations[7?C12].
Changes in rainfall erosivity are closely related to climate change, and global
climate change exerts extremely complex effects on rainfall erosivity[13].
However, few studies on the rainfall erosivity caused by global climate change
are available, and datasets related to rainfall erosivity and global climate change are scarce.
El Niño?CSouthern
Oscillation (ENSO) is an
important influencing factor of global climate change. The eigenvalues of ENSO
include Sea Surface Temperature (SST) anomaly in the central and eastern equatorial
Pacific, Southern Oscillation Index (SOI), and Multivariate ENSO Index (MEI).
Changing these characteristic values leads to corresponding changes in rainfall
erosivity. ENSO and global precipitation differ. For example, precipitation
increased in most parts of South America when an ENSO warm event occurred;
winter precipitation in eastern Asia also showed an increasing trend, which
resulted in less summer precipitation in eastern Asia and southern Asia and
less precipitation in Africa[14?C16]. Although studies on the effect
of ENSO on precipitation are available, works on the effect of ENSO on rainfall
erosivity are limited[13,17]. On
the basis of the rainfall data of Shaoguan city in Guangdong province from 1951
to 2013, this study analyzed the influence of each index value on the rainfall
erosivity in the city through the index value of ENSO. The current dataset
contained the ENSO eigenvalue of rainfall erosion force in Shaoguan city and
its influence on the city and even the southern red soil with low hill areas in
China. This dataset provides theoretical basis for the comprehensive control of
soil erosion and reference for related research datasets. This study provides
references for the monitoring, assessment, and management of soil erosion in
related areas.
2 Metadata of Dataset
The metadata of
??Effects of ENSO on the annual rainfall erosivity in Shaoguan city of Guangdong
province (1951-2013)??[18] are shown in
Table 1, including the dataset full and short names, authors, year of the
dataset, temporal resolution, spatial resolution, data format, data size, data
files, data publisher, and data sharing policy.
Table 1 Metadata summary of ??Effects of ENSO on the
annual rainfall erosivity in Shaoguan city of Guangdong province (1951?C2013)??
|
Items
|
Description
|
|
Dataset full name
|
Effects of ENSO on the annual rainfall
erosivity in Shaoguan city of Guangdong province (1951?C2013)
|
|
Dataset short name
|
ENSO_RainfallErosivityShaoguan_1951?C2013
|
|
Authors
|
Chen, S. F. 0000-0002-1273-9668, College of Tourism and
Geography, Shaoguan University,
sgxycsf@163.com
|
|
Geographical region
|
Shaoguan city, Guangdong province (23??5'N?C25??31'N, 112??50'E?C114??45'E,)
|
|
Year
|
1951?C2013 Data
format .xlsx Data size 116.5
KB
|
|
Data files
|
The dataset includes (1) rainfall erosive force and anomaly in Shaoguan
city of Guangdong province from 1951 to 2013, including annual rainfall
erosive force, 5-year sliding average rainfall erosive force, rainfall
erosivity distance, and 5-year sliding rainfall erosivity anomaly; (2) monthly ENSO index values from 1951 to 2013 and
monthly rainfall erosivity data, including monthly rainfall erosivity over
the years, Sea Surface Temperature anomaly in the central and eastern
equatorial Pacific, Southern Oscillation Index, and Multivariate ENSO Index
|
|
Foundations
|
Guangdong province (GD18XGL55, 2015KQNCX148); Shaoguan
city (G2017017, 2018sn055)
|
|
Data publisher
|
Global Change Research Data Publishing
& Repository, http://www.geodoi.ac.cn
|
|
Address
|
No. 11A, Datun Road, Chaoyang District,
Beijing, 100101, China
|
(To be continued on the next page)
(Continued)
|
Items
|
Description
|
|
Data sharing policy
Communication and
searchable system
|
Data from the Global Change Research Data Publishing &
Repository includes metadata, datasets
(data products), and publications (in this case, in the Journal
of Global Change Data & Discovery). Data sharing policy includes: (1) Data
are openly available
and can be free downloaded via the Internet; (2) End users are encouraged to
use Data subject to citation; (3) Users, who are by definition also value-added
service providers, are welcome to redistribute Data subject to written permission from
the GCdataPR Editorial Office and the issuance of a Data redistribution license, and; (4) If Data are used to compile new datasets, the ??ten percent
principal?? should be followed such that Data records utilized should not surpass 10% of the new
dataset contents, while sources should be clearly noted in suitable places in
the new dataset[19]
DOI??GCdataPR??DCI??GEOSS??ChinaGEO??CSCD
|
3 Data Development Method
3.1 Date Sources
The
rainfall data used came from the monthly rainfall data of Shaoguan city from
1951 to 2013 as provided by the China Meteorological Sharing Service
(http://data.cma.cn/). On the basis of the monthly rainfall data, the erosion
of monthly rainfall was calculated to calculate the erosion of annual rainfall
in Shaoguan city.
Published ENSO
data from the United States and Atmospheric Administration Climate Prediction
Center (http://www.esrl.noaa.gov/) included monthly SST anomaly values, SOI,
and MEI data (1951?C2013).
3.2 Algorithm Principle
The rainfall erosivity model proposed by Zhou[8] was adopted to calculate
rainfall erosivity using the monthly rainfall data of weather stations. The
model formula is as follows:
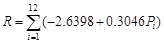 (1)
(1)
where Pi is the monthly rainfall (mm) and R is the annual rainfall erosion erosivity (MJ??mm??hm?C2??h?C1??a?C1).
Formula (1) was
used to calculate the monthly rainfall erosivity in Shaoguan city, and the
rainfall erosivity in a year could be obtained by accumulation.
An El Niño or a la
Niña (anti-El Niño) event was considered when the SST anomaly in the eastern
equatorial Pacific was higher or lower than 0.5 ??C and lasted for more than 6 months (one month less than 0.5 ??C was allowed).
3.3 Technical Route
Shaoguan city in Guangdong province was used to
analyze the effect of ENSO on rainfall erosivity. The technical route is shown
in Figure 1. The change rules of SSTA, SOI, and MEI data of Shaoguan city in Guangdong
province in the period of 1951?C2013 were obtained by using the average monthly
rainfall data of the city and the ENSO index. On this basis, SPSS 19.0 statistical
software was used to analyze the rainfall erosivity, correlation among ENSO
indices, influence of ENSO on rainfall erosion erosivity, and ENSO mechanism in
Shaoguan city.
|
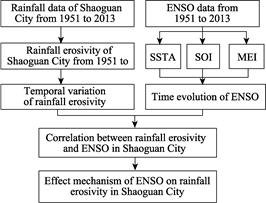
Figure 1 Technical route of the data development
|
4 Results and Validation
4.1 Dataset Composition
(1)
Data of rainfall erosivity and anomaly in Shaoguan city of Guangdong province
from 1951 to 2013, including annual rainfall erosivity, 5-year sliding average
rainfall erosivity, precipitation erosivity, and 5-year sliding rainfall erosivity
anomaly;
(2) Monthly ENSO index values from 1951?C2013
and monthly rainfall erosivity data, including monthly rainfall erosivity over
the years, MEI, SOI, and ocean SST data.
4.2 Data Results
The
average annual rainfall erosivity from 1951 to 2013 in Shaoguan city of Guangdong
province was 476.53 MJ??mm??hm?C2??h?C1??a?C1. The
maximum monthly rainfall erosivity over the years was 180.52 MJ??mm??hm?C2??h?C1??a?C1,
while the minimum value was 0 MJ??mm??hm?C2??h?C1??a?C1.
The maximum was 646.27 MJ??mm??hm?C2??h?C1??a?C1 in 1994
and the minimum was 302.53 MJ??mm??hm?C2??h?C1??a?C1
in 1963. The average monthly rainfall erosivity was 39.71 MJ??mm??hm?C2??h?C1??a?C1.
The rainfall erosivity of May was the largest and reached as high as 78.64 MJ??mm??hm?C2??h?C1??a?C1,
and the smallest was in December at only 14.03 MJ??mm??hm?C2??h?C1??a?C1[17].
According to the fitting curve of monthly rainfall erosivity (Figure 2), the rainfall
erosivity was the largest from April to July, while the monthly rainfall erosivity
was the lowest from November to February.
|
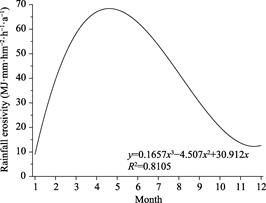
Figure 2 Variation curve of
rainfall erosivity from 1951 to 2013 in Shaoguan city
|
The
rainfall erosivity distance showed a fluctuating trend. The 5-year sliding average
of rainfall erosivity distance in Shaoguan city was calculated. From 1992 to
2013, the negative anomaly of rainfall erosivity reached the maximum value,
while the total rainfall erosivity from 1992 to 2013 was in the positive
anomaly. The cumulative anomaly value fluctuated greatly, and the rainfall
erosivity in this stage was highly abrupt. The rainfall erosivity showed a
linear upward trend, which was a negative anomaly before the mid-1980s and a
positive anomaly after the mid- 1980s [17-18].
As shown in Figure 3, 20 ENSO warm events (Figure
3A) and 13 ENSO cold events (Figure 3B) occurred from 1951 to 2013. During the
ENSO cold and warm events, the average monthly rainfall erosivity was 35.44 MJ??mm??hm?C2??h?C1??a?C1. The average monthly rainfall
erosive forces were 36.75 and 33.88 MJ??mm??hm?C2??h?C1??a?C1 in the warm and
cold event periods, respectively. Although the erosive force of rainfall in the
warm event period was higher than that in the cold event period, the erosive
force of rainfall in each cold event period fluctuated more than that in the
warm event period. The rainfall erosivity of Shaoguan city was relatively large
during the non-ENSO cold and warm events. Meanwhile, the rainfall erosivity was
relatively small during ENSO cold and warm events, especially during ENSO cold
events.
The rainfall erosivity of Shaoguan city was significantly correlated
with the SST anomaly in the central and eastern equatorial Pacific (P<0.01). The rainfall erosivity was
significantly correlated with the presence of SOI (P<0.05), and the rainfall erosivity gradually decreased with the
increase in SOI. Rainfall erosivity increased with the increase in MEI (P<0.01), which indicated a very
significant positive correlation between the two variables, and the correlation
between rainfall erosivity and MEI was stronger than that between SST anomaly
and SOI.
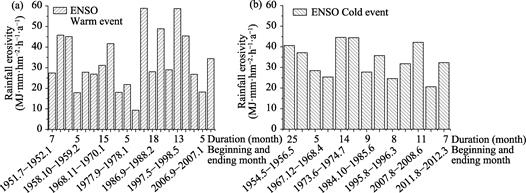
Figure 3 ENSO cold and warm events
and rainfall erosivity from 1951 to 2013
(a is ENSO warm
event; b is ENSO cold event)
Using the monthly
rainfall erosivity formula of rainfall erosivity from 1951 to 2013 is suitable for low-precipitation and rich southern
hill areas. However, the obtained daily and hourly rainfall erosivity values
show no difference in rainfall intensity of rainfall erosivity, and extreme
precipitation is affected by global climate change. Thus, future research
should consider different relationships with ENSO rainfall erosion force
formula in consideration of a comprehensive system to reflect the effects of
global climate change on rainfall erosivity.
5 Discussion and Conclusion
The
current dataset was based on the monthly rainfall erosivity of Shaoguan city in
the period of 1951−2013. The monthly rainfall erosivity formula was used to
calculate the monthly rainfall erosivity, and the ENSO eigenvalue data were
used to analyze the correlation between rainfall erosivity and ENSO. The
dataset showed that the rainfall erosivity increased slightly in the period of
1951?C2013, and the annual and monthly variations in rainfall erosivity were
relatively large. The monthly rainfall erosivity of ENSO warm event was higher
than that of ENSO cold event with a value of 33.88 MJ??mm??hm?C2??h?C1??a?C1.
The rainfall erosion increased first and then decreased with the increase in
SST anomaly. It decreased with the increase in SOI and increased with the increase
in MEI.
The analysis of the datasets of ENSO events of Shaoguan
city provides data support for the ENSO influence on rainfall erosivity.
Correlation analysis can be used to describe the influence mechanism. Rainfall
erosion force, intensity, and duration have important influences on rainfall
erosion erosivity. However, not all affecting factors of rainfall erosivity are
considered. The future research will consider different rainfall intensities,
durations, and erosion force changes in analyzing the ENSO influence. The
current dataset provides basic data and methodological reference for calculating
the monthly rainfall erosivity over long time scales in similar areas and its
relationship with global climate change.
References
[1]
Panos, P., Cristiano, B.,
Pasquale, B., et al. Rainfall
erosivity in Europe [J]. Science of the
Total Environment, 2015, 511:801?C814.
[2]
Anton,
V., Joost, C. B., Marijn, V. Towards large-scale monitoring of soil erosion in
Africa: accounting for the dynamics of rainfall erosivity [J]. Global and Planetary Change, 2014,
115(4):33?C43.
[3]
Zhao,
P. W., Guo, P. Spatial and temporal variations of rainfall erosivity in
Northwest Yunnan province during 1980?C2013[J]. Scientia Geographica Sinica, 2015, 35(10): 1306?C1311.
[4]
Wischmeier,
W. H., Smith, D. D. Predicting rainfall erosion losses: a guide to conservation
planning [M]. US Department of Agriculture, Science and Education
Administration, Agriculture Research, Agriculture Handbook, 1978, No.537.
[5]
Renard,
K. G., Freidmund, J. R. Using monthly precipitation data to estimate the
R-factor in the RUSLE [J]. Journal of
Hydrology, 1994, 157(4):287?C306.
[6]
Yu,
B. F., Rosewell, C. J. A robust of the R-factor for the universal soil loss
equation [J]. Transaction of the American
Society of Agricultural Engineers, 1996, 39(2):559?C561.
[7]
Zhang,
W. B., Xie, Y., Liu, B. Y. Rainfall erosivity estimation using daily rainfall
amounts [J]. Scientia Geographica Sinica,
2002, 22(6): 705?C711.
[8]
Zhou,
F. J., Chen, M. H., Lin, F. X., et al.
The rainfall erosivity index in Fujian Province [J]. Journal of Soil and Water Conservation, 1995, 9(1): 13?C18.
[9]
Huang,
Y. H., Lu, C. L., Zheng, T. F., et al.
Study on rainfall erosivity index in Southeastern Fujian [J]. Journal of Soil and Water Conservation, 1992,
6(4): 25?C30.
[10]
Yu,
B. F. Rainfall erosivity and its estimation for Australia??s tropics [J]. Australian Journal of Soil Research,
1998, 36(1), 143?C166.
[11]
Richardson,
C. W., Foster, G. R., Wright, D. A. Estimation of erosion index from daily
rainfall amount [J]. Transactions of the
American Society of Agricultural Engineers, 1983, 26(1): 153?C160.
[12]
Loureiro, N. D. S., Coutinho, M. D. A. A new procedure to
estimate the RUSLE EI30 index, based on monthly rainfall data and applied to
the Algarve region, Portugal [J]. Journal
of Hydrology, 2001, 250(1): 12?C18.
[13]
Chen, S. F., Zha, X. Effects of the ENSO on rainfall
erosivity in the Fujian Province of southeast China [J]. Science
of the Total Environment, 2018,621:1378?C1388.
[14]
Haylock,
M. R., Peterson, T. C., Alves, L. M., et
al. Trends in total and extreme south American rainfall in 1960?C2000 and
links with sea surface temperature [J]. Journal
of Climate, 2006, 19(8): 1490?C1512.
[15]
Bradfield,
L. The strength of El Niño and the spatial extent of tropical drought [J]. Geophysical research letters, 2004,
31(21): 1?C4.
[16]
Mason,
S. J., Goddard, L. Probabilistic precipitation anomalies associated with ENSO
[J]. Bulletin of the American
meteorological society, 2001, 82(4): 619?C638.
[17]
Chen,
S. F. Effects of ENSO on rainfall erosivity in Shaoguan city during 1951?C2013
[J]. Scientia Geographica Sinica,
2016, 36(10): 1573?C1580.
[18]
Chen,
S. F. Dataset of effects of ENSO on annual rainfall erosivity in Shaoguan city,
Guangdong province (1951?C2013) [DB/OL]. Global Change Research Data Publishing
& Repository, 2018. DOI: 10.3974/geodb.2018.06.02.V1.
[19]
GCdataPR Editorial Office. GCdataPR data sharing policy
[OL]. DOI: 10.3974/dp.policy.2014.05 (Updated 2017).