Standardized Statistical Dataset of Haze Weather in Hubei Province, China (1961-2013)
Wang, K.* Zhou, Y. H. Fang, S. D. Zhang, L. W.
Wuhan Regional Climate Center, Wuhan 430074, China
Abstract: By utilizing the daily data, timing humidity data and manual data of weather phenomena (haze and mist) from 76 meteorological stations in Hubei province from 1961 to 2013, and the evaluation model of large scale persistent haze processes, the standardized statistical dataset of haze weather in Hubei province, China (1961-2013) was developed. The dataset is consisted of the data covering Hubei province from 1961-2013: (1) the statistical data for haze days and haze processes; (2) spatial distribution data of haze days; (3) spatial distribution data of haze days in standardized sequence in Hubei from 1961 to 2013; (4) spatial distribution data of difference between haze days and haze days in standardized sequence; (5) frequency of occurrence of large-scale persistent severe haze processes. This dataset is archived at .xls, .shp and .tif formats in 12 files with data size of 570 KB (compressed in one file of 148 KB).
Keywords: Hubei; large-scale; persistent; haze
1 Introduction
Recently, the influence of haze weather becomes more serious. In particular, the persistent haze process affecting the central and eastern China in winter of 2013 caused severe impact on the health and life of residents, and aroused widespread public concern in the society. Currently, there is no unified quantitative criterion for the haze observation[1–2], and the relevant studies are mainly focused on the climatic characteristics and the formation of haze weather, whereas the evaluation of haze process is very limited[3–5]. Combing with the actual social needs of Hubei province, it is urgent to study the objective and effective assessment technology of regional haze process, especially the large scale persistent haze process, which will provide the effective data support for the prevention and management of regional polluted weather. This paper uses the day-to-day observation data for the weather phenomena of haze and mist from 76 meteorological stations in Hubei province from 1961 to 2013, supplemented by the visibility data and daily timing relative humidity data to reestablish the haze sequence in Hubei province. By adopting the statistical analysis, EOF analysis, disaster detection and other methods, we obtain a standardized statistical dataset of haze weather in Huber province from 1961 to 2013.
2 Metadata of Dataset
The information of name, authors, geographic region, year of data, temporal resolution, spatial resolution, dataset components, data publishing and shared service platform and data shared policy is shown in Table 1.
Table 1 Metadata summary of standardized haze weather statistical dataset in Hubei province (1961-2013)
|
Items
|
Description
|
|
Dataset full name
|
|
|
Dataset short name
|
HazeHubei_1961-2013
|
|
Authors
|
Wang, K. E-9539-2018, Wuhan Regional Climate Center, 68461180@qq.com
Zhou, Y. H. F-3701-2018, Wuhan Regional Climate Center, zyh_dmm@foxmail.com
Fang, S. D. F-1974-2018, Wuhan Regional Climate Center, fang_star123@163.com
|
|
Zhang, L. W. F-3448-2018, Wuhan Regional Climate Center, luomarsp2013@163.com
|
|
Geographical region
|
Hubei province Year 1961-2013
|
|
Data format
|
.shp, .tif, .xls Data size 142 KB (compressed) Data files 6
|
|
Foundation(s)
|
2013 Hubei technological support plan project (2013BCB020)
|
|
Data publisher
|
Global Change Research Data Publishing & Repository, http://www.geodoi.ac.cn
|
|
Address
|
No. 11A, Datun Road, Chaoyang District, Beijing 100101, China
|
|
Data sharing policy
|
Data from the Global Change Research Data Publishing & Repository includes metadata, datasets (data products), and publications (in this case, in the Journal of Global Change Data & Discovery). Data sharing policy includes: (1) Data are openly available and can be free downloaded via the Internet; (2) End users are encouraged to use Data subject to citation; (3) Users, who are by definition also value-added service providers, are welcome to redistribute Data subject to written permission from the GCdataPR Editorial Office and the issuance of a Data redistribution license; and (4) If Data are used to compile new datasets, the ‘ten percent principal’ should be followed such that Data records utilized should not surpass 10% of the new dataset contents, while sources should be clearly noted in suitable places in the new dataset[7]
|
3 Research and Development Method of Data
3.1 Source of Data
The meteorological data used in this study are the daily visibility data, timing relative humidity data and manual observation data of weather phenomena (haze and mist) from 76 meteorological stations in Hubei province from 1961 to 2013. The data are provided by Hubei Meteorological Information and Information Support Center after quality control.
3.2 Algorithm Principle
(1) Raw haze weather historical sequence of Hubei province
The raw haze weather historical sequence of Hubei province is the manual day-to-day haze observation data from 76 meteorological stations in Hubei province from 1961 to 2013. For each station, the haze days in a year are the sum of daily values; the annual average is the arithmetic mean for years; the year-to-year annual average of Hubei province is the arithmetic mean of stations (hereinafter).
(2) Standardized haze weather historical sequence of Hubei province
Based on the raw haze weather historical sequence of Hubei province, the visibility observation data from 1961 to 2013 have been processed with homogenization[6]. We define the meaning of haze day and reestablish the historical haze day sequence of Hubei province.
The observation data of visibility before 1980 are classified into 10 levels. In order to ensure that the data format is unified to the distance unit, the reasonable visibility distances are assigned to the visibility observation levels before 1980 (Table 2).
Table 2 Visibility levels corresponding to ranges and estimated values of visibility distances
|
Visibility
level
|
The distance range of visibility /km
|
The estimated value
of visibility /km
|
|
0
|
??0.05
|
0.025
|
|
1
|
0.05-0.2
|
0.1
|
|
2
|
0.2-0.5
|
0.28
|
|
3
|
0.5-1.0
|
0.7
|
|
4
|
1.0-2.0
|
1.41
|
|
5
|
2.0-4.0
|
2.67
|
|
6
|
4.0-10.0
|
6.77
|
|
7
|
10.0-20.0
|
13.58
|
|
8
|
20.0-50.0
|
29.04
|
|
9
|
??50.0
|
54.27
|
We define the haze day according to the weather phenomenon part of Ground meteorological observation specification (QX/T 45— 2007) and Observation and Forecast Level of Haze (QXT113—2010) as below:
?? Record ‘haze’ or ‘mist’ in the weather phenomenon column of observation data on the day;
?? Visibility<10 km and relative humidity<80%;
?? The weather phenomenon is ‘haze’ and the weather condition at any observation time meets the requirement ??; or the weather is ‘mist’ while the weather conditions at observation times which meet requirement ?? must include 0800 LT and 2000 LT for at least 3 times in 4 times or at least 6 times in 24 times. Then a day is defined as haze day if it meets the three requirements above.
(3) Evaluation model of large scale persistent haze process
Define the concept of large scale persistent haze process and build large scale persistent haze period index (LSCHI)[9]. The calculation formula is:
LSCHI=0.5×T'+0.4×C'+0.1×Vi' (1)
where T' is the duration after the standardized processing; C' is the coverage range after the standardized processing; Vi' is the haze intensity after the standardized processing.
The calculation formula of coverage range (C) is:
C=n/N (2)
where n is the number of observation stations selected according to the definition of large scale persistent haze process during the observation period; N is the total amount of stations during the observation period.
The calculation formula of haze intensity (Vi) is:

 (3)
(3)
where n is the number of observation stations selected according to the definition of large scale persistent haze process; m is the duration of large scale persistent haze process (d); Vd is the visibility on the dth day at the selected station (km).
The formula of standardized processing is:
 (4)
(4)
where x is the random value of the raw sequence; xmax is the maximum of the raw sequence; xmin is the minimum of the raw sequence; x' is the standardized random value of the rawsequence. The standardized process of visibility calculated as10-Vi. The division grades of LSCHI are shown in Table 3.
3.3 Technology Route
Table 3 Division grades of large scale persistent haze period index in Hubei province
|
Grade
|
LSCHI index
|
|
Light (III)
|
≤0.18
|
|
Moderate (II)
|
>0.18, ≤0.35
|
|
Severe (I)
|
>0.35
|
We synthesize the relevant standards in the weather phenomenon part of Ground Meteorological Observation Specification (QX/T 45-2007) and Observation and Forecast Level of Haze (QXT113-2010) to define haze days, and process the visibility observation data with homogenization. Furthermore, we introduce daily timing relative humidity data and manual observation data of weather phenomenon (mist) to correct the manual haze observation data, forming the standardized sequence. According to the standardized sequence, we build the assessment model of large scale persistent haze process, and conduct the related statistical analysis.
4 Data Result and Verification
4.1 Data Result
The dataset includes the following data covering Hubei province from 1961-2013: the statistical data of haze days; the statistical dataset about geographic locations of stations with haze; the distribution data of the raw Hubei haze weather sequence; the distribution data of the standardized Hubei haze weather sequence; the spatial distribution data of difference between haze days and haze days in standardized sequence and the spatial distribution data of occurrence frequency of large scale persistent severe haze process.
4.2 Data Verification
The data result showed in Figure 2 correspond to dataset 1 published in paper “Characteristics of persistent haze periods using large range sequence reconstruction in Hubei province”[9]. Due to the influence of the change of observation specification, the discrepancy between the results is distinct before 1970s while the results are consistent after 1970s.
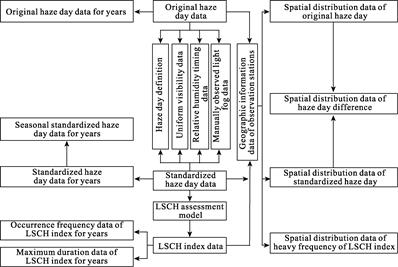
Figure 1 Research process of the standardized Hubei haze weather statistical dataset
5 Discussion and Conclusion
Under the background of climate change, the average wind speed in China decreases while the stable weather increases. The days of precipitation decline sharply, leading to the weakening of atmospheric diffusion condition. Moreover, the regional haze problem gradually becomes more severe. After 2013, the impact of haze on the development of social economy and life of the public is growing. On the basis of regular observations, developing the observation of aerosols that significantly affect haze will effectively boost the recognition of haze and afford abundant basic data for the further research of haze effects.
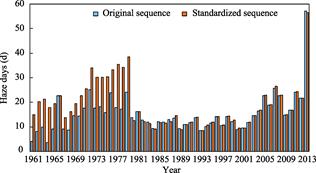
Figure 2 Comparison of variation trends between the raw haze weather historical sequence of Hubei province and the standardized sequence during 1961-2013
Author Contributions
Wang, K. and Zhou, Y. H. implemented the overall design for the development of dataset. Wang, K. and Fang, S. D. designed the model and algorithm. Fang, S. D. collected and processed the statistical data, and Zhang, L. W. collected and processed the vector and raster data. Wang, K. wrote the data paper.
References
[1] Wu, D. A discussion on difference between haze and fog and warning of ash haze weather [J]. Meteorological Monthly, 2005, 31(4): 3-7.
[2] Wu, D. Discussion on the distinction between haze and fog and analysis and processing of data [J]. Environmental Chemistry, 2008, 27(3): 327-330.
[3] Hu, Y. D., Zhou, Z. J. Climatic characteristics of haze in China [J]. Meteorological Monthly, 2009, 35(7): 73-78.
[4] Gao, G. The climatic characteristics and change of haze days over China during 1961-2005 [J]. Acta Geographihca Sinica, 2008, 63(7): 761-768.
[5] Wu, H. Y., Du, Y. D., He, J., et al. Climatic characteristics and variations of haze days and fog days in South China [J]. Meteorological Monthly, 2011, 37(5): 607-614.
[6] Wang, K., Zhou, Y. H., Fang, S.D., et al. Yearly standardized dataset of haze events in Hubei province, China (1961-2013) [DB/OL]. Global Change Research Data Publishing & Repository, DOI: 10.3974/geodb.2018.01.17.V1.
[7] GCdataPR Editorial Office. GCdataPR Data Sharing Policy [OL]. DOI: 10.3974/dp.policy.2014.05 (Updated 2017).
[8] Qin, S. J., Shi, G. Y., Chen, L., et al. Long-term variation of aerosol optical depth in China based on meteorological horizontal visibility observations [J]. Chinese Journal of Atmospheric Sciences, 2010, 34(2): 449-456.
[9] Wang, K., Fang, S. D., Li, L., et al. Characteristics of persistent haze periods using large range sequence reconstruction in Hubei province [J]. Journal of Meteorology and Environment, 2016, 32(1): 40-45.