Population Dataset in Vietnam
(2000?C2019)
Yin,
X.1, 2 Li, P.1, 2 Feng, Z. M.1, 2*
You, Z.1, 2 Xiao,
C. W.1
1. Institute of Geographic Sciences and Natural Resources
Research, Chinese Academy of Sciences, Beijing 100101, China;
2. University of Chinese Academy of Sciences, Beijing
100049, China
Abstract: Vietnam, as the third
most populous country in Southeast Asia, is one of the key-node countries along
the Green Silk Road. Population dataset in Vietnam (2000?C2019) was developed based on the
demographic data, LandScan population grid data from 2000 to 2019, geographical
zone data, as well as Vietnam administrative division and their adjustment
data. The dataset includes three levels: whole country, six geographical
regions, and 63 provinces (cities), and the time span is 2000?C2019. The dataset is archived in .shp
and .xlsx data formats, and consists of 8 data files with data size of 1.41 MB (compressed
into one data file, 884 KB).
Keywords: population
distribution; Vietnam; provincial level; dataset; the Belt and Road Initiative
DOI: https://doi.org/10.3974/geodp.2022.01.01
CSTR: https://cstr.escience.org.cn/CSTR:20146.14.2022.01.01
Dataset Availability Statement:
The
dataset supporting this paper was published and is accessible through the Digital Journal of
Global Change Data Repository at: https://doi.org/10.3974/geodb.2021.06.04.V1 or
https://cstr.escience.org.cn/CSTR:20146.11.2021.06.04.V1.
1 Introduction
Vietnam, an important land and neighboring country of Lao, Cambodia
and China, is one of the key-node countries along the Green Silk Road. With an
average growth rate of 6.5% in GDP from 2000 to 2019, Vietnam has become
China??s largest trading partner among Association of Southeast Asia Nations
(ASEAN) countries since 2015[1]. The fifth census of Vietnam in 2019
showed that the country had a total population of 96,208,984, and would soon
become the world??s 15th country with a population of over 100
million. Population as the key factor of climate change, disaster risk and
epidemic spreading[2?C4], integrating the population distribution
datasets, e.g., national, six geographical regions and 63 provinces (cities),
is very useful for the development of scientific research on the Vietnam??s
human-nature interrelationship.
The demographic data from
the General Statistics Office of Vietnam from 2000 to 2019, and supplemented by
LandScan[5,6] dataset of OAK Ridge National Laboratory during the
same period, and then used the spatial analysis method of ArcGIS software.
Finally, the Population dataset in Vietnam from 2000 to 2019 is integrated.
2 Metadata of the Dataset
The metadata of the Population dataset in regions of Vietnam
(2000?C2019)[7] is summarized in Table 1. It includes the dataset
full name, short name, authors, year of the dataset, temporal resolution,
spatial resolution, data format, data size, data files, data publisher, and
data sharing policy, etc.
Table 1 Metadata summary of the Population dataset in regions of Vietnam
(2000?C2019)
|
Items
|
Description
|
|
Dataset full name
|
Population dataset in regions of Vietnam
(2000?C2019)
|
|
Dataset short name
|
PopulationVietnam_2000-2019
|
|
Authors
|
Yin, X. 0000-0003-2498-4115,
Institute of Geographic Sciences and Natural Resources Research, Chinese
Academy of Sciences, yinx.19b@igsnrr.ac.cn
Li, P. 0000-0002-0849-5955,
Institute of Geographic Sciences and Natural Resources Research, Chinese
Academy of Sciences, lip@igsnrr.ac.cn
Feng, Z. M.
M-5550-2018, Institute of Geographic Sciences and Natural Resources Research,
Chinese Academy of Sciences,
fengzm@igsnrr.ac.cn
You, Z. M-5487-2018, Institute of
Geographic Sciences and Natural Resources Research, Chinese Academy of Sciences,
youz@igsnrr.ac.cn
Xiao, C. W.
0000-0003-3477-9406, Institute of Geographic Sciences and Natural Resources
Research, Chinese Academy of Sciences, xiaocw@igsnrr.ac.cn
|
|
Geographical region
|
Vietnam
|
|
Year
|
2000?C2019
|
|
Temporal resolution
|
Yearly
|
|
Spatial resolution
|
National, geographical regions, and
provinces
|
|
Data format
|
.shp, .xlsx
|
|
|
|
Data size
|
884 KB (after
compression)
|
|
|
|
Data files
|
The dataset consists of two parts: (1)
Annual population data of Vietnam in .xlsx format for the whole country, six
geographic regions and 63 provinces (cities) from 2000 to 2019; (2) Annual
population data of Vietnam??s provinces from 2000 to 2019 in shapefile format
|
|
Foundations
|
Chinese Academy of Sciences
(XDA20010203, 2020055); National Natural Science Foundation of China
(41971242)
|
|
Data publisher
|
Global Change
Research Data Publishing & Repository, http://www.geodoi.ac.cn
|
|
Address
|
No. 11A, Datun Road, Chaoyang District,
Beijing 100101, China
|
|
Data sharing policy
|
Data from the Global Change Research Data
Publishing & Repository includes metadata, datasets
(in the Digital Journal of Global Change Data Repository), and
publications (in the Journal of Global Change Data & Discovery). Data sharing policy includes: (1) Data
are openly available and can be free downloaded via the Internet; (2) End
users are encouraged to use Data subject to citation; (3)
Users, who are by definition also value-added service providers, are welcome
to redistribute Data subject to written permission from the GCdataPR Editorial
Office and the issuance of a Data redistribution license; and (4)
If Data
are used to compile new datasets, the ??ten per cent principal?? should be
followed such that Data records utilized should not
surpass 10% of the new dataset contents, while sources should be clearly
noted in suitable places in the new dataset[8]
|
|
Communication
and searchable system
|
DOI, CSTR, Crossref, DCI, CSCD, CNKI, SciEngine, WDS/ISC, GEOSS
|
3 Methods
3.1 Data Sources
Demographic statistics and administrative divisions (six
geographical divisions and 63 provincial administrative units) are all from
General Statistics Office of Vietnam.
Except for the mid-year census data in April 1, 2019, the data in 2000?C2018 are
all total population at the end of the year. In addition, the vector
administrative boundaries of Vietnam??s 63 provinces (cities) are derived from
Vietnam Open Development Data.
3.2 Data Processing
The data processing includes interpolation of missing
values and spatialization of population. First, we interpolated the missing
values of some provinces. The problem of missing population values in some
provinces is mainly caused by the adjustment of provincial administrative
divisions. From 2000 to 2019, Vietnam??s provincial units had undergone two
adjustments: (1) In 2004, one municipality directly under the central
government and two provinces were added. Can Tho city, the capital of Can Tho province
in southern Vietnam, was separated out as a municipality directly under the
central government, and the remainder of Can Tho province became Hau Giang
province. In addition, a part of Lai Chau province is separated out to set up
Dien Bien province, and a part of Dak Lak province is separated out to set up
Dak Nong province. (2) In 2008, Ha Tay province was merged into the capital, Ha
Noi city. Therefore, we employed the ??Zonal statistics as table?? tool in ArcGIS
software to interpolate the missing values, with the specific process as
follows: (1) We used the current provincial vector administrative boundaries
and LandScan to calculate the total population of Hau Giang, Dien Bien and Dak
Nong from 2000 to 2003, and revised by the values of former provinces of Can
Tho, Lai Chau and Dak Lak. In the end, we obtained the total population of Hau
Giang, Dien Bien and Dak Nong from 2000 to 2003. (2) The population of Ha Tay
province before 2008 was merged into that of Ha Noi city. (3) According to the
??code?? attribute field of 63 provinces (cities) in Vietnam, the vectorized
administrative region was linked to the province??s population from 2000 to
2019. There are six geographic regions and 63 provincial units in total. Table
2 presented the 63 provincial administrative divisions in Vietnam.
Table 2 Provincial
administrative divisions in Vietnam
|
Geographical Regions (Number)
|
Provinces (Cities)
|
|
Red
River Delta (11)
|
Ha
Noi, Vinh Phuc, Bac Ninh, Quang Ninh, Hai Duong, Hai Phong, Hung Yen, Thai
Binh, Ha Nam, Nam Dinh, Ninh Binh
|
|
Northern midlands and mountain areas (14)
|
Ha
Giang, Cao Bang, Bac Kan, Tuyen Quang, Lao Cai, Yen Bai, Thai Nguyen, Lang
Son, Bac Giang, Phu Tho, Dien Bien, Lai Chau, Son La, Hoa Binh
|
|
Northern central
area and central coastal area (14)
|
Thanh
Hoa, Nghe An, Ha Tinh, Quang Binh, Quang Tri, Thua Thien-Hue, Da Nang, Quang
Nam, Quang Ngai, Binh Dinh, Phu Yen, Khanh Hoa, Ninh Thuan, Binh Thuan
|
|
Central
highlands (5)
|
Kon
Tum, Gia Lai, Dak Lak, Dak Nong, Lam Dong
|
|
South
East (6)
|
Binh Phuoc, Tay Ninh, Binh Duong, Dong Nai, Ba Ria -
Vung Tau, Ho Chi Minh city
|
|
Mekong
River Delta (13)
|
Long
An, Tien Giang, Ben Tre, Tra Vinh, Vinh Long, Dong Thap, An Giang, Kien Giang,
Can Tho, Hau Giang, Soc Trang, Bac Lieu, Ca Mau
|
4 Data Results
The dataset consists of two
parts: (1) Land area of Vietnam and six
geographic regions as well as annual population of 63 provinces (cities) from
2000 to 2019 in the .xlsx format; (2) Spatial distribution of population of 63
provinces (cities) in Vietnam from 2000 to 2019 in shapefile format.
4.1 National Land Area and
Population Change Data
The land area of Vietnam is 329,600 km2, ranking
4th in Southeast Asia. Figure 1 shows the total population and
population growth rate of Vietnam from 2000 to 2019.
Since the 21st century, the population of Vietnam has increased from
77.63 million in 2000 to 96.21 million in 2019, with an average annual growth
rate of about 1.20%. If calculated based on an average annual growth rate of
1%, the population of Vietnam will exceed 100 million in 2023, becoming the 15th
country with a population of over 100 million in the world. In addition,
Vietnam is a country with high population density, which was 290 persons/km2
in 2019, a value much higher than the world average of 60 persons/km2.
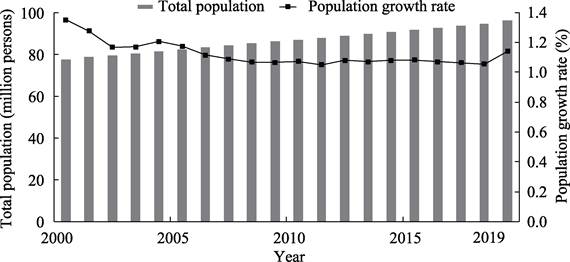
Figure 1 Total population and growth rate from
2000 to 2019 in Vietnam
4.2 Regional Land Area and
Population Change Data
Among the six geographic regions of Vietnam, the Northern
Central Area and Central Coastal Area and the Northern Midlands and Mountain
Areas are the largest two regions with a land area exceeding 90,000 km2.
While the Red River Delta and the South East are the smallest ones, with a land
area of 21,000 km2 and 23,000 km2, respectively. In terms
of total population, the figure for Red River Delta with the largest population
exceeded 22 million in 2019, while that for the Central Highlands, the
least-populous region, was less than 6 million.
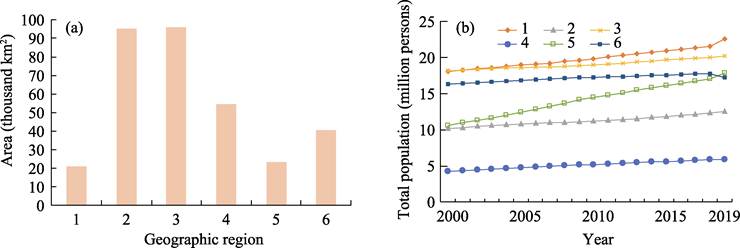
Figure 2 Land area and
population of six geographic regions in Vietnam
Notes: Figure 2a shows the land area of
Vietnam??s six geographic regions, and Figure 2b shows their population change
from 2000 to 2019. The figures 1, 2, 3, 4, 5 and 6 represent the Red River
Delta, the Northern Midlands and Mountain Areas, the Northern Central Area and
Central Coastal Area, the Central Highlands, the South East, and the Mekong
River Delta, respectively.
As for the population growth rate, the South East was the
fastest-growing region, with an average annual growth rate of 2.72%, while the
Mekong River Delta, which showed the slowest growth, had an average annual
growth rate of only 0.48%. As regards the population density, the Red River
Delta was the most populous region whose population density exceeded 1,000
persons/km2, followed by the South East and Mekong River Delta; while
the Northern Midlands and Mountain Areas and Central Highlands were sparsely
populated areas, with a population density of less than 150 persons/km2
(Figure 2, Table 3).
Table 3 Population characteristics in the six geographic regions of Vietnam in 2000,
2010, and 2019
|
Geographical
regions
|
|
2000
|
|
|
2010
|
|
|
2019
|
|
|
Total
population (million persons)
|
Population growth rate (%)
|
Population density (person
/km2)
|
Total population (million persons)
|
Population growth rate (%)
|
Population density (person
/km2)
|
Total population (million persons)
|
Population growth rate (%)
|
Population density (person
/km2)
|
|
Red River Delta
|
1,806.07
|
1.02
|
857
|
1,985.19
|
1.19
|
942
|
2,254.36
|
1.41
|
1,070
|
|
Northern midlands and mountain areas
|
1,020.44
|
1.18
|
107
|
1,118.43
|
1.00
|
117
|
1,253.29
|
1.26
|
132
|
|
Northern central area and central
coastal area
|
1,821.83
|
0.46
|
190
|
1,897.52
|
0.63
|
198
|
2,018.73
|
0.69
|
211
|
|
Central highlands
|
424.64
|
3.67
|
78
|
520.44
|
1.47
|
95
|
584.27
|
1.33
|
107
|
|
South East
|
1,060.45
|
3.77
|
449
|
1,448.03
|
2.34
|
614
|
1,782.89
|
2.37
|
756
|
|
Mekong River Delta
|
1,629.66
|
0.69
|
402
|
1,725.13
|
0.30
|
425
|
1,727.36
|
0.05
|
426
|
4.3 Provincial Land Area and
Population Change Data
4.3.1 Land Area
and Population Change Data in the Red River Delta
|
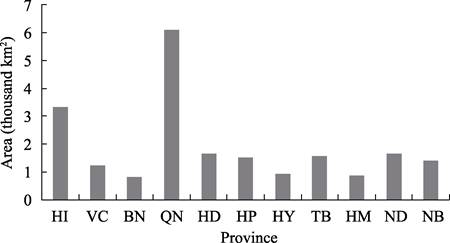
Figure 3 Land area of the 11 provinces (cities)
in the Red River Delta
Notes: The HI, VC, BN, QN, HD, HP, HY, TB, HM, ND and NB
are the abbreviation of Ha Noi, Vinh Phuc, Bac Ninh, Quang Ninh, Hai Duong,
Hai Phong, Hung Yen, Thai Binh, Ha Nam, Nam Dinh and Ninh Binh.
|
In terms of land area, among the 11 provinces (cities) in
the Red River Delta, Quang Ninh province ranks first with an area over 6,100 km2,
while Bac Ninh and Hung Yen provinces have the smallest areas with less than
1,000 km2. Regarding the total population, Ha Noi, the capital city
of Vietnam, ranked first with a population of 8.05 million in 2019. Ha Nam and
Nam Dinh were the least-populated provinces, both of which had a population
less than one million. With regard to the population growth rate, Bac Ninh
province and Ha Noi city grew most rapidly in population, with an average
annual growth exceeding 2%. Nam Dinh was the only province that experienced
negative population growth in the Red River Delta. Overall, the population
density of this region was relatively high. Among the 11 provinces (cities), Ha
Noi city was the most populous, with a population density over 2,400 persons/km2,
and Quang Ninh province was the least populated one, also with a figure over
200 persons/km2 (Figure 3, Table 4).
Table 4 Population characteristics in the provinces
of Red River Delta of Vietnam in 2000, 2010, and 2019
|
Geographical
regions
|
|
2000
|
|
|
2010
|
|
|
2019
|
|
|
Total population (million persons)
|
Population growth rate (%)
|
Population density (person
/km2)
|
Total population (million persons)
|
Population growth rate (%)
|
Population density (person
/km2)
|
Total population (million persons)
|
Population growth rate (%)
|
Population density (person
/km2)
|
|
Ha
Noi
|
519.79
|
2.39
|
1,561
|
663.36
|
2.5
|
1,993
|
805.37
|
2.22
|
2,419
|
|
Vinh
Phuc
|
110.41
|
0.9
|
893
|
100.76
|
0.72
|
815
|
115.12
|
1.41
|
931
|
|
Bac Ninh
|
95.06
|
0.81
|
1,155
|
104.42
|
1.72
|
1,269
|
136.88
|
2.90
|
1,664
|
|
Quang
Ninh
|
102.42
|
1.69
|
168
|
115.72
|
0.97
|
190
|
132.03
|
1.42
|
216
|
|
Hai
Duong
|
165.69
|
0.36
|
1,001
|
171.64
|
0.56
|
1,036
|
189.23
|
1.04
|
1,143
|
|
Hai
Phong
|
169.15
|
0.88
|
1,110
|
185.78
|
0.95
|
1,220
|
202.85
|
0.99
|
1,332
|
|
Hung
Yen
|
107.9
|
0.71
|
1,165
|
113.23
|
0.33
|
1,223
|
125.27
|
1.05
|
1,353
|
|
Thai
Binh
|
178.94
|
0.07
|
1,140
|
178.47
|
0.09
|
1,137
|
186.04
|
0.43
|
1,185
|
|
Ha
Nam
|
79.38
|
0.16
|
922
|
78.63
|
0.01
|
914
|
85.28
|
0.84
|
991
|
|
Nam
Dinh
|
188.65
|
‒0.29
|
1,142
|
183
|
0.09
|
1,108
|
178.04
|
?C0.26
|
1,078
|
|
Ninh
Binh
|
88.68
|
0.2
|
638
|
90.17
|
0.23
|
649
|
98.25
|
0.89
|
707
|
4.3.2 Land Area
and Population Change Data in Provinces of the Northern Midlands and Mountain
Areas
In
terms of land area, among the 14 provinces in the Northern Midlands and
Mountain Areas, Son La province
ranks first with an area over 14,000 km2, while Thai Nguyen, Phu
Tho, and Bac Giang provinces have the smallest areas that are less than 4,000
km2. In 2019, the total
|
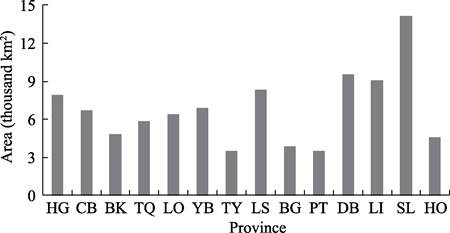
Figure 4 Land area of
the 14 provinces in the Northern Midlands and Mountain Areas
Notes:
The HG, CB, BK, TQ, LO, YB, TY, LS, BG, PT, DB, LI, SL and HO are the
abbreviation of Ha Giang, Cao Bang, Bac Kan, Tuyen Quang, Lao Cai, Yen Bai,
Thai Nguyen, Lang Son, Bac Giang, Phu Tho, Dien Bien, Lai Chau, Son La and
Hoa Binh.
|
population of each province in this region were relatively
small. Among these provinces, Bac Giang province had the highest population of
1.8 million, and most provinces had a total population of less than one
million, among which Bac Kan and Lai Chau had a total population of less than 500,000. In terms of population growth rate,
most provinces had a relatively fast population growth rate. The population
growth rates of Dien Bien and Lai Chau provinces exceeded 2%, and that of Gao
Binh, which was the slowest, also reached 0.4%. The population density of all
provinces in this region were relatively low. Approximately 80% of the
provinces had a population density of less than 200 persons/km2, and
the population density of six provinces were less than 100 persons/km2
(accounting for 43%) (Figure 4, Table 5).
4.3.3 Land Area
and Population Change Data in Provinces of the Northern Central Area and
Central Coastal Area
In terms of land area, among the 14 provinces (cities) in
the Northern Central Area and Central Coastal Area, Nghe An province ranks
first with more than 14,000 km2, while Da Nang city has the smallest
area with less than 1,300 km2. In terms of total population, Thanh
Hoa and Nghe An had the largest population in 2019, both exceeding three
million, while Ninh Thuan and Quang Tri had the smallest population that were
only around 600,000.
Table 5 Population
characteristics in the provinces of Northern Midlands
and Mountain Areas of Vietnam in 2000, 2010, and
2019
|
Geographical
regions
|
|
2000
|
|
|
2010
|
|
|
2019
|
|
|
Total population (million persons)
|
Population growth rate (%)
|
Population density (person
/km2)
|
Total population (million persons)
|
Population growth rate (%)
|
Population density (person
/km2)
|
Total population (million persons)
|
Population growth rate (%)
|
Population density (person
/km2)
|
|
Ha
Giang
|
61.92
|
2.2
|
78
|
73.38
|
1.2
|
93
|
85.47
|
1.65
|
108
|
|
Cao
Bang
|
49.39
|
0.37
|
74
|
51.31
|
0.37
|
76
|
53.03
|
0.45
|
79
|
|
Bac
Kan
|
27.84
|
0.72
|
57
|
29.75
|
0.98
|
61
|
31.39
|
0.66
|
65
|
|
Tuyen
Quang
|
68.41
|
1
|
117
|
72.93
|
0.57
|
124
|
78.48
|
0.8
|
134
|
|
Lao
Cai
|
60.74
|
1.49
|
95
|
62.68
|
1.79
|
98
|
73.04
|
1.73
|
114
|
|
Yen
Bai
|
68.8
|
0.86
|
100
|
75.13
|
1.29
|
109
|
82.10
|
1.03
|
119
|
|
Thai
Nguyen
|
105.55
|
0.73
|
299
|
113.13
|
0.52
|
320
|
128.68
|
1.36
|
364
|
|
Lang
Son
|
70.79
|
0.28
|
85
|
73.63
|
0.42
|
88
|
78.17
|
0.65
|
94
|
|
Bac
Giang
|
150.27
|
0.47
|
391
|
156.98
|
0.83
|
408
|
180.40
|
1.49
|
469
|
|
Phu
Tho
|
127.01
|
0.5
|
359
|
132.27
|
0.46
|
374
|
146.37
|
1.06
|
414
|
|
Dien
Bien
|
37.06
|
3.29
|
39
|
50.12
|
2.12
|
52
|
59.89
|
2
|
63
|
|
Lai
Chau
|
24.62
|
3.94
|
27
|
38.08
|
2.53
|
42
|
46.02
|
2.17
|
51
|
|
Son
La
|
90.99
|
2.64
|
64
|
109.89
|
1.83
|
78
|
124.84
|
1.49
|
88
|
|
Hoa
Binh
|
77.05
|
1.42
|
167
|
79.16
|
0.66
|
172
|
85.41
|
0.84
|
185
|
Table 6 Population
characteristics in provinces of the Northern Central
Area and Central Coastal Area of Vietnam in
2000, 2010, and 2019
|
Geographical
regions
|
|
2000
|
|
|
2010
|
|
|
2019
|
|
|
Total population (million persons)
|
Population growth rate (%)
|
Population density (person
/km2)
|
Total population (million persons)
|
Population growth rate (%)
|
Population density (person
/km2)
|
Total population (million persons)
|
Population growth rate (%)
|
Population density (person
/km2)
|
|
Thanh Hoa
|
346.82
|
?C0.18
|
312
|
342.18
|
0.51
|
307
|
364.01
|
0.68
|
327
|
|
Nghe An
|
287.11
|
0.21
|
174
|
293.41
|
0.67
|
178
|
332.78
|
1.33
|
202
|
|
Ha Tinh
|
126.84
|
?C0.21
|
211
|
123.27
|
0.4
|
206
|
128.89
|
0.49
|
215
|
|
Quang Binh
|
80.21
|
0.79
|
99
|
84.86
|
0.43
|
105
|
89.54
|
0.58
|
111
|
|
Quang Tri
|
57.76
|
0.47
|
122
|
60.17
|
0.52
|
127
|
63.24
|
0.55
|
133
|
|
Thua Thien-Hue
|
105.21
|
0.29
|
209
|
109.09
|
0.3
|
217
|
112.86
|
0.37
|
224
|
|
Da Nang
|
70.61
|
2.74
|
549
|
92.27
|
3.15
|
718
|
113.43
|
2.45
|
882
|
|
Quang Nam
|
138.25
|
0.49
|
132
|
143.32
|
0.72
|
137
|
149.58
|
0.5
|
143
|
|
Quang Ngai
|
119.43
|
0.2
|
232
|
122.1
|
0.31
|
237
|
123.17
|
0.12
|
239
|
|
Binh Dinh
|
146.61
|
0.06
|
242
|
149.2
|
0.31
|
247
|
148.69
|
0
|
246
|
|
Phu Yen
|
79.96
|
1.15
|
158
|
86.61
|
0.43
|
171
|
87.30
|
0.12
|
173
|
|
Khanh Hoa
|
104.96
|
1.42
|
201
|
116.43
|
0.53
|
223
|
123.11
|
0.62
|
236
|
|
Ninh Thuan
|
51.67
|
1.83
|
154
|
56.95
|
0.65
|
170
|
59.05
|
0.44
|
176
|
|
Binh Thuan
|
106.39
|
1.24
|
136
|
117.68
|
0.63
|
151
|
123.08
|
0.53
|
158
|
In terms of population growth rate, except Da Nang city,
which had a faster growth rate of 2.45%, most provinces (accounting for 86%)
had an average annual population growth rate of less than 0.7%. In terms of
population density, Da Nang city had the highest population density, exceeding
880 persons/km2, whereas Quang Binh province had the lowest
population density, which was only 111 persons/km2 (Figure 5, Table
6).
4.3.4 Land Area
and Population Change Data in Provinces of the Central Highlands
In terms of land area, among the five provinces in the
Central Highlands, the two provinces of Gia Lai and Dak Lak have larger land
areas, with more than 15,000 km2 and 13,000 km2,
respectively, while Dak Nong province had relatively small area, with only
6,500 km2. In terms of total population, Dak Lak province had more
than 1.8 million in 2019, while the total population of Kon Tum and Dak Nong
provinces were relatively small, which were only about 600,000. The population
growth rate of all provinces was relatively fast. The population growth rates
of Kon Tum and Dak Nong provinces in 2019 both exceeded 2%, and even that of
Dak Lak province, which was the slowest, also exceeded 0.75%. The population
density of all provinces were below 150 persons/km2, and that of Kon
Tum province was less than 60 persons/km2 (Figure 6, Table 7).
|
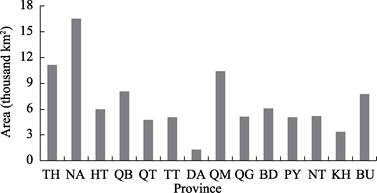
Figure 5 Land area of the 14 provinces (cities)
in
the northern
central area and central coastal area
Notes: The TH, NA, HT, QB, QT, TT, DA, QM, QG, BD,
PY, KH, NT and BU are the abbreviation of Thanh Hoa, Nghe An, Ha Tinh, Quang
Binh, Quang Tri, Thua Thien-Hue, Da Nang, Quang Nam, Quang Ngai, Binh Dinh,
Phu Yen, Khanh Hoa, Ninh Thuan and Binh Thuan.
|
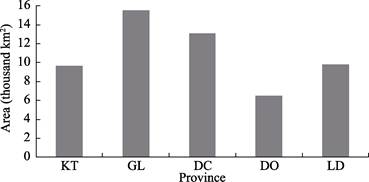
Figure 6 Land
area of the five provinces in the central highlands
Notes: The KT,
GL, DC, DO and LD are the abbreviation of Kon Tum, Gia Lai, Dak Lak, Dak Nong
and Lam Dong.
|
Table 7 Population
characteristics in provinces of the Central Highlands in 2000, 2010, and 2019
|
Geographical
regions
|
|
2000
|
|
|
2010
|
|
|
2019
|
|
|
Total population (million persons)
|
Population growth rate (%)
|
Population density (person
/km2)
|
Total population (million persons)
|
Population growth rate (%)
|
Population density (person
/km2)
|
Total population (million persons)
|
Population growth rate (%)
|
Population density (person
/km2)
|
|
Kon
Tum
|
32.81
|
3.63
|
34
|
44.21
|
2.39
|
46
|
54.04
|
2.28
|
56
|
|
Gia
Lai
|
102.63
|
4.56
|
66
|
130.16
|
1.61
|
84
|
151.38
|
1.72
|
97
|
|
Dak
Lak
|
140.46
|
‒1.05
|
107
|
175.27
|
0.98
|
134
|
186.93
|
0.75
|
142
|
|
Dak
Nong
|
45.63
|
0.76
|
70
|
50.38
|
2.61
|
77
|
62.22
|
2.4
|
95
|
|
Lam
Dong
|
103.11
|
2.64
|
105
|
120.41
|
1.24
|
123
|
129.69
|
0.88
|
133
|
4.3.5 Land Area
and Population Change Data in Provinces of the South East
In
terms of land area, among the six provinces (cities) in the South East, Binh
Phuoc province ranks first with more than 7,000 km2, while Ba
Ria-Vung Tau province and Ho Chi Minh city have the smallest areas of around
2,000 km2. In terms of total population, Ho Chi Minh city had the
largest population of nearly nine million in 2019, while Binh Phuoc province
had the smallest population of less than one million. In terms of population
growth rate, all provinces grew fast, among which Binh Duong province had a
population growth rate of nearly 5%, and that of Ho Chi Minh city also exceeded
2%. The population density of all provinces were relatively high. Ho Chi Minh
city had a population density of more than 4,200 persons/km2, and
only Binh Phuoc province had a population density of less than 150 persons/km2
(Figure 7, Table 8).
|
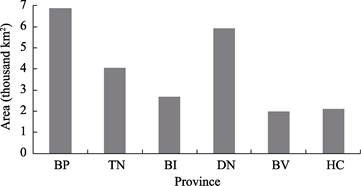
Figure 7 Land
area of the six provinces (cities) in the South East
Notes: The BP, TN, BI, DN, BV and HC are
the abbreviation of Binh Phuoc, Tay Ninh, Binh Duong, Dong Nai, Ba Ria-Vung
Tau and Ho Chi Minh.
|
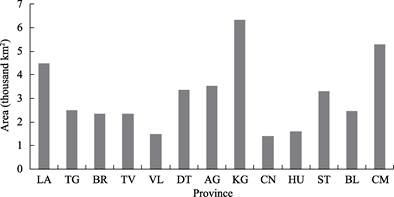
Figure 8 Land
area of the 13 provinces (cities) in the Mekong River Delta
Notes: The LA, TG, BR, TV, VL, DT, AG, KG,
CN, HU, ST, BL and CM are the abbreviation of Long An, Tien Giang, Ben Tre,
Tra Vinh, Vinh Long, Dong Thap, An Giang, Kien Giang, Can Tho, Hau Giang, Soc
Trang, Bac Lieu and Ca Mau.
|
Table 8 Population
characteristics in provinces of the South East in 2000, 2010, and 2019
|
Geographical
regions
|
|
2000
|
|
|
2010
|
|
|
2019
|
|
|
Total population (million persons)
|
Population growth rate (%)
|
Population density (person
/km2)
|
Total population (million persons)
|
Population growth rate (%)
|
Population density (person
/km2)
|
Total population (million persons)
|
Population growth rate (%)
|
Population density (person
/km2)
|
|
Binh
Phuoc
|
68.29
|
4.69
|
99
|
88.58
|
1.23
|
129
|
99.47
|
1.3
|
145
|
|
Tay
Ninh
|
98.33
|
1.58
|
243
|
107.43
|
0.67
|
266
|
116.92
|
0.92
|
289
|
|
Binh
Duong
|
77.94
|
8.13
|
289
|
159.08
|
5.18
|
590
|
242.66
|
4.93
|
901
|
|
Dong
Nai
|
205.41
|
2.73
|
348
|
257.15
|
2.87
|
435
|
309.71
|
2.2
|
524
|
|
Ba
Ria-Vung Tau
|
82.99
|
3.08
|
417
|
101.13
|
1.28
|
508
|
114.83
|
1.42
|
577
|
|
Ho
Chi Minh
|
527.49
|
3.98
|
2,517
|
734.66
|
2.09
|
3,506
|
899.31
|
2.28
|
4,291
|
4.3.6 Land Area
and Population Change Data in Provinces of the Mekong River Delta
In
terms of land area, among the 13 provinces (cities) in the Mekong River Delta,
Kien Giang and Ca Mau province have larger land areas, exceeding 6,000 km2
and 5,000 km2, respectively, while Can Tho city and Vinh Long province
have smaller land areas that are less than 1500 km2. Most provinces
in this region mainly had a population of one million to two million in 2019,
and only the two provinces of Hau Giang and Bac Lieu had a population of less
than one million. In terms of population growth rate, most provinces
experienced slow growth. Among them, the six provinces of Vinh Long, Dong Thap,
An Giang, Hau Giang, Soc Trang and Ca Mau experienced negative population
growth (accounting for 46%). The population density of all provinces were
relatively high. Can Tho city had a population density of more than 870
persons/km2, and even that of Ca Mau province, which was the
slowest, was more than 220 persons/km2 (Figure 8, Table 9).
Table 9 Population
characteristics in provinces of the Mekong River
Delta of Vietnam in 2000, 2010, and 2019
|
Geographical
regions
|
|
2000
|
|
|
2010
|
|
|
2019
|
|
|
Total population (million persons)
|
Population growth rate (%)
|
Population density (person
/km2)
|
Total population (million persons)
|
Population growth rate (%)
|
Population density (person
/km2)
|
Total population (million persons)
|
Population growth rate (%)
|
Population density (person
/km2)
|
|
Long
An
|
132.71
|
1.22
|
295
|
144.28
|
0.45
|
321
|
168.85
|
1.62
|
376
|
|
Tien
Giang
|
161.35
|
0.32
|
643
|
167.8
|
0.31
|
669
|
176.42
|
0.54
|
703
|
|
Ben
Tre
|
129.79
|
‒0.09
|
550
|
125.66
|
0.04
|
532
|
128.85
|
0.26
|
546
|
|
Tra
Vinh
|
97.2
|
0.3
|
415
|
100.8
|
0.48
|
431
|
100.92
|
0.06
|
431
|
|
Vinh
Long
|
101.34
|
0.11
|
677
|
102.65
|
0.14
|
686
|
102.28
|
?C0.02
|
683
|
|
Dong
Thap
|
158.06
|
0.79
|
468
|
166.96
|
0.18
|
494
|
159.95
|
?C0.41
|
474
|
|
An
Giang
|
206.17
|
0.31
|
583
|
214.83
|
0.03
|
607
|
190.84
|
?C1.16
|
540
|
|
Kien
Giang
|
152.27
|
1.23
|
240
|
169.87
|
0.6
|
268
|
172.31
|
0.2
|
271
|
|
Can
Tho
|
109.84
|
0.77
|
780
|
119.79
|
0.78
|
850
|
123.52
|
0.39
|
877
|
|
Hau
Giang
|
73.23
|
0.82
|
457
|
75.98
|
0.24
|
474
|
73.30
|
?C0.33
|
457
|
|
Soc
Trang
|
119.34
|
1.32
|
360
|
129.56
|
0.19
|
391
|
119.97
|
?C0.75
|
362
|
|
Bac
Lieu
|
74.97
|
1.56
|
304
|
86.1
|
0.49
|
349
|
90.72
|
0.58
|
367
|
|
Ca
Mau
|
113.39
|
0.93
|
214
|
120.85
|
0.12
|
228
|
119.45
|
?C0.1
|
226
|
4.4
Spatio-temporal Data of 63 Provinces (Cities) in Vietnam from 2000 to 2019
Figure 9 shows the provincial spatial distribution of
population in Vietnam from 2000 to 2019. Overall, the Red River Delta in the
north and the Mekong River Delta in the south are two densely populated areas,
while the Truong Son Mountains in the central region is sparsely populated. For
63 provinces (cities), most provinces in Vietnam have a population of one
million to two million, while the population of Ho Chi Minh city and Ha Noi
city, the first and second populous province-level units, reaches 8.99 million
and 8.05 million, respectively. The least-populous province is Bac Kan in the
north, with a total population of only 0.31 million.
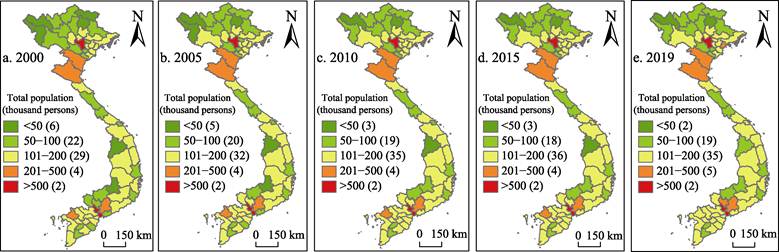
Figure 9 Provincial spatial distribution of population
in Vietnam from 2000 to 2019
Note: The number in the parentheses
indicates the number of provinces under the classification.
5 Discussion and Conclusion
This dataset collected
the demographic data on the website of the General Statistics Office
of
Vietnam from 2000 to 2019, and used the ArcGIS software to vectorize the
population data in the provincial-level, and finally integrated the population
dataset in Vietnam from 2000 to 2019. This dataset can provide data support for
the research on the Vietnam??s human-nature interrelationship, such as climate
change, disaster risk and epidemic spreading.
Author
Contributions
Yin,
X. was primarily responsible for the dataset design, model calculation, and
manuscript writing. Feng, Z. M. designed the algorithms of dataset. Li, P., You, Z., and Xiao, C. W. contributed to the data
processing and analysis.
Conflicts of Interest
The authors declare no conflicts of interest.
References
[1]
Chinese Academy of International
Trade and Economic Cooperation, Economic and Commercial Affairs Section of the
Chinese Embassy in Vietnam, Department of Foreign Investment and Economic
Cooperation of Ministry of Commerce People??s Republic of China. Country
(Region) Guide for Foreign Investment Cooperation-Vietnam (2020 Edition) [DB/OL]. Beijing, 2020.
[2]
Tian, X. Y., Zhai, Z. W., Li, J.
N. Demography [M]. Hangzhou: Zhejiang People??s Publishing House, 2004: 10?C12.
[3]
Zhang, S. China Population
Geography [M]. Beijing: Science Press, 2007: 243?C285.
[4]
Feng, Z. M., Li, P. Review of
population geography in the past century [J]. Progress in Geography, 2011, 30(2): 131?C140.
[5]
Dobson, J., Bright, E., Coleman, P., et al. LandScan: a global population database for estimating
populations at risk [J]. Photogrammetric
Engineering and Remote Sensing, 2000, 66(7): 849?C857.
[6]
Bhaduri, B., Bright, E., Coleman, P., et al. LandScan USA: a high-resolution geospatial and temporal
modeling approach for population distribution and dynamics [J]. GeoJournal, 2007, 69(1/2): 103?C117.
[7]
Yin, X., Li, P., Feng, Z. M., et al. Population dataset in regions of Vietnam
(2000?C2019) [J/DB/OL]. Digital Journal of
Global Change Data Repository,
2021. https://doi.org/10.3974/geodb.2021.06.04.V1.
https://cstr.escience.org.cn/CSTR:20146.11.2021.06.04.V1.
[8]
GCdataPR Editorial Office.
GCdataPR data sharing policy [OL]. https://doi.org/10.3974/dp.policy.
2014.05 (Updated 2017).