Dataset of Terrestrial Water Storage and Its
Response to ENSO in the Three Parallel Rivers Basin (2002?C2016)
Zhu, Y.1,2 Liu, S.
Y.1,2* Yi, Y.1,2 Xie, F. M.1,2
1.
Institute of International Rivers and Eco-Security, Yunnan University, Kunming 650091,
China;
2. Yunnan
Key Laboratory of International Rivers and Transboundary Eco-security, Kunming 650091,
China
Abstract: The Three Parallel Rivers
Basin (TPRB) is characterized by rough terrain and variable climate. The
significant water cycle heterogeneity in the TPRB can be captured by the change
in terrestrial water storage (TWS). In this dataset, the boundary of the TPRB
was extracted based on the SRTM (30 m), integrated with the GloRiC dataset,
Google Earth images, and related research results. The TWS in the TPRB was
retrieved using the GRACE RL06 GSM monthly gravity field model from 2002 to
2016, and the results were corrected using a double-scale factor. The relationship
between ENSO and TWS was quantified by linear fitting. The dataset includes:
(1) the boundary of the TPRB (.shp); (2) spatiotemporal variation data of TWS,
including the retrieved water reserves and model results for comparison (.nc);
and (3) response data of TWS to ENSO (.nc). The data in (2) and (3) are
archived in fifteen layers and different dimensions (one, two, or three
dimensions) in NetCDF with monthly data in 1??x 1?? spatial resolution. The
dataset is archived in two data files with data size of 1.69 MB.
Keywords: TPRB; TWS; ENSO; 2002-2016
Dataset Availability Statement:
The
dataset supporting this paper was published and is accessible through the Digital Journal of Global Change Data
Repository at: https://doi.org/10.3974/geodb.2020.08.12.V1.
1 Introduction
The
Three Parallel Rivers Basin (TPRB) is located in the transitional area between
the eastern Qinghai?CTibet Plateau and the Yunnan?CGuizhou Plateau, with large
topographic relief, a complex climate background, and significant heterogeneity
in the water cycle. The TPRB, as an important World Natural Heritage site, has
attracted much attention to its hydrological processes, climate change, and
ecological protection. In the context of global warming, frequent natural disasters have posed serious threats
to economic production, life, and tourism development in this region[1].
In recent years, the frequent natural disasters in this area have mainly been
large-scale droughts and floods. Some studies have pointed out that anomalies
in the terrestrial water cycle are the primary reason for the occurrence of
droughts and floods[2-4]. Anomalous
changes in terrestrial water storage (TWS) can be used to effectively identify
and monitor drought and flood events, and to
link climate change with these events. Therefore, a dataset of spatiotemporal
variations in TWS in the TPRB has important practical significance for the assessment
of regional drought and flood disasters and the clarification of regional water
cycle characteristics.
TWS can be
obtained by site monitoring and model simulation. The former is limited by
terrain conditions and costs, and continuous monitoring results are difficult
to obtain, while the latter depends on the verification of observations. In
contrast, retrieving TWS from remote sensing data shows great application
potential[5]. Many scholars have applied Gravity Recovery and
Climate Experiment (GRACE) data to carry out numerous studies on topics
including drought monitoring, groundwater inversion, water storage and
discharge effects of large reservoirs, and
contributions of ice/snow melting to sea level changes[6,7]. GRACE
data has great potential for
monitoring global water storage since its spatial resolution is continuously
improved in the follow-up satellite plans such as GRACE-Fo (GRACE Follow On)[7].
Meteorological
factors play an important role in the water cycle. They show that extreme
climate events such as the El Nino?CSouthern Oscillation (ENSO) can influence precipitation
and induce temperature anomalies by affecting the atmospheric circulation, and
eventually lead to regional and even global water storage anomalies, resulting
in extreme drought and flooding[8]. The interannual variations of
TWS in most regions of the world have a strong correlation with ENSO[9],
and this is especially so for the TWS anomalies in some regions fully dominated
by ENSO[10]. Therefore, it is necessary to consider the impact of
ENSO on TWS, especially in such special areas as the TPRB.
2 Metadata of
the Dataset
The
metadata of the Dataset of terrestrial water storage and its response to ENSO
in the Three Parallel Rivers Basin[11] is summarized in Table 1.
3 Methods for Data Production
Development
3.1 Watershed Boundary
Data
The boundary of the basin was
extracted from SRTM with a spatial resolution of 30 m based on the pysheds
(http://mattbartos.com/pysheds/) and the Google Earth platform. The specific
steps are as follows.
The
pysheds1 was used to conduct operations including filling, flow
direction, and flow routing on SRTM data.
The
preliminary boundary was extracted based on the results of step (1) and the outlet,
which was determined by prior studies and the requirement to avoid the impact
of reservoirs in the middle and lower reaches.
1 pysheds.
http://mattbartos.com/pysheds/.
Table 1 Metadata summary of the Dataset of terrestrial
water storage and its response to ENSO in the Three Parallel Rivers Basin
|
Items
|
Description
|
|
Dataset full name
|
Dataset of terrestrial water storage
and its response to ENSO in the Three Parallel Rivers Basin
|
|
Dataset short
name
|
TWS_ENSO_TPRB
|
|
Authors
|
Zhu Y. ABD-2058-2020, Institute of International Rivers and
Eco-Security, Yunnan University, yuzhu@mail.ynu.edu.cn
Liu S. Y. AAT-4278-2020, Institute of International Rivers and
Eco-Security, shiyin.liu@ynu.edu.cn
Yi Y. ABD-3176-2020, Institute of International Rivers and
Eco-Security, yingyi@mail.ynu.edu.cn
Xie F. M. ABD-3175-2020, Institute of International Rivers and
Eco-Security, xfm@mail.ynu.edu.cn
|
|
Geographical
region
|
27??N-36??N, 90??E-101??E
Year
Aug. 2002-Sep. 2016
|
|
Time resolution
|
1 month Spatial
resolution 1??
|
|
Data format
|
.shp, .nc
|
Data size 1.69 MB
|
|
Data files
|
(1)
boundary of the TPRB (TPRB.shp)
(2)
TWS and its associated data (TPRB_TWS_ENSO_2002-2016.nc)
|
|
Foundations
|
National
Natural Science Foundation of China (41761144075); Chinese Academy of
Sciences (2019QZKK0208); Yunnan University (YJRC3201702)
|
|
Computing environment
|
Python 3.7
|
|
Data publisher
|
Global Change
Research Data Publishing & Repository,
http://www.geodoi.ac.cn
|
|
Address
|
No. 11A, Datun Road, Chaoyang District,
Beijing 100101, China
|
|
Data sharing
policy
|
Data from the Global
Change Research Data Publishing &
Repository includes metadata, datasets (in the Digital
Journal of Global Change Data Repository),
and publications (in the Journal of Global Change Data & Discovery).
Data sharing policy includes: (1) Data are openly available and can be free downloaded
via the Internet; (2) End users
are encouraged to use Data subject
to citation; (3) Users, who are by definition also value-added service
providers, are welcome to redistribute Data subject to written
permission from the GCdataPR Editorial Office and the issuance of a Data
redistribution license; and (4) If Data are used to compile new datasets, the ??ten percent principal?? should be followed such that Data records
utilized should not surpass 10% of the new dataset contents, while
sources should be clearly noted in suitable places in the new dataset[12]
|
|
Communication and searchable system
|
DOI, DCI, CSCD, WDS/ISC, GEOSS, China GEOSS, Crossref
|
Obvious
inconsistencies between the initial boundary and the boundary found by GloRiC[13]2 were marked. The
boundaries in the water outlet area, the glacier/snow-covered area, the deep
ridge and valley area, and especially the marked area in (3) were checked and
modified under the condition of a viewing altitude of 1?C2 km on the Google
Earth platform to obtain a final accurate boundary of the TPRB.
3.2 Inversion of TWS
The
GRACE LEVEL-2 (RL06) GSM3 monthly gravity field model from August
2012 to August 2016, released by the Center for Space Research, University of
Texas at Austin (UTCSR), was employed in this study. The procedures for
deriving TWS from GRACE are shown as follows.
(1) Data
preprocessing
It is necessary to filter the GRACE
solutions to reduce the introduction of errors in original data. The errors
that must be processed mainly include the C20 of GRACE, the north?Csouth strips,
and the errors in the high-order spherical harmonic coefficient. Generally, the
GRACE C20 data were replaced by SLR C20 data, which include more seasonal characteristics,
and the other two errors were primarily removed by filtering[14].
The specific pro-
3 CSR
GRACE/GRACE-FO RL06 Mascon Solutions (version 02).
http://www2.csr.utexas.edu/grace/RL06_mascons.html.
cessing
flow is shown in Figure 1.
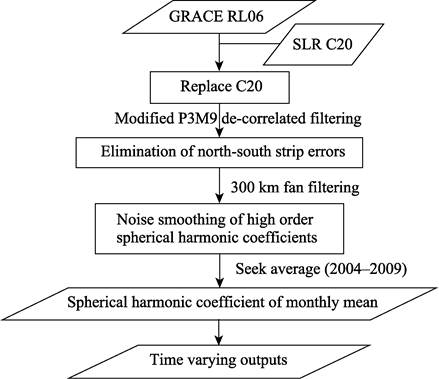
Figure
1 Flow chart of
data preprocessing
(2) Conversion of gravity signal
Generally, the
change in TWS is expressed by Equivalent Water Thickness (EWT). The change in
TWS will cause a change in the spherical gravity field[15]. Based on
this theory, the gravity signal of a certain point (??, ??) in the earth can be
converted into the change signal of TWS (??h) through Equation (1)[16]:
 (1)
(1)
where
R represents the mean radius of the
earth;  refer to the
geocentric latitude and longitude of the calculation points, respectively;
refer to the
geocentric latitude and longitude of the calculation points, respectively;  is the average density of the earth;
  is the average
density of water; kn denotes the loading Love numbers; both
is the average
density of water; kn denotes the loading Love numbers; both  and
and  are normalized
spherical harmonic coefficients;
are normalized
spherical harmonic coefficients;  indicates the
normalized m order n multiplied by the Legendre function;
and N is the order of the spherical harmonic coefficients. Studies have
identified significant errors in the higher-order terms. As a result, the
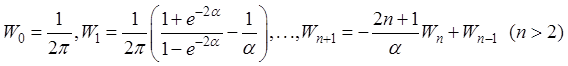
higher-order terms usually must be truncated (generally, N=60)[17-19]. Both Wn and Wm
are Gaussian filtering smoothing functions. When r1/2
represents the filter radius, the Gaussian kernel function W is
calculated using Equation (2).
indicates the
normalized m order n multiplied by the Legendre function;
and N is the order of the spherical harmonic coefficients. Studies have
identified significant errors in the higher-order terms. As a result, the
higher-order terms usually must be truncated (generally, N=60)[17-19]. Both Wn and Wm
are Gaussian filtering smoothing functions. When r1/2
represents the filter radius, the Gaussian kernel function W is
calculated using Equation (2).
 (2)
(2)
(3) Recovery of the attenuated
signal amplitude
Although preprocessing can effectively reduce the
errors in the original data, it inevitably leads to the attenuation of the
gravity signal amplitude. In data production, the double-scale factor method
was used to recover the amplitude signal (see reference [5] for the specific
content). The processing steps were as follows:
a) The spherical harmonic expansion of the
GLDAS TWS was calculated (the expansion order is the same as for GRACE, and is
here the 60th order).
b) The same postprocessing procedures used
for GRACE data were conducted on the spherical harmonic coefficient of the
GLDAS TWS.
c) The normalized spherical harmonic coefficients before and
after preprocessing were used to calculate the corresponding EWT PPT and APT in the study area, respectively.
d) The trend items ( and
and  ) and the seasonal items (
 and
and  ) were acquired by using STL[20-22] to decompose the
  and
and  .
.
e) The regional scale factors (S1 and S2) were calculated according to the principle of
minimizing the sum of squares of residual errors for the time series (including
the trend term and seasonal term) before and after processing, that is, 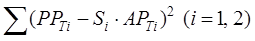 is the minimum.
f) Two scale factors were used to recover the seasonal
term and trend term, respectively, and finally, we obtained the recovered TWS
via the inverse calculation of STL.
3.3 Quantification of the Relationship
Between TWS and ENSO
A linear fitting method was
used to quantify the response mechanism of TWS to ENSO[23-24]. First, STL decomposition was used to obtain the
effective signal of TWS change ( ); then,
Equation (3) was used to fit the relationship between the effective signal and
ENSO, and the fitting coefficients (a, b, and c) were calculated. Finally, the
amplitude (AMP) and phase lag (Phase) were calculated by Equation (4). The
); then,
Equation (3) was used to fit the relationship between the effective signal and
ENSO, and the fitting coefficients (a, b, and c) were calculated. Finally, the
amplitude (AMP) and phase lag (Phase) were calculated by Equation (4). The 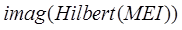 term gives the
imaginary part of the ENSO index MEI by the Hilbert transform.
term gives the
imaginary part of the ENSO index MEI by the Hilbert transform.
 (3)
(3)
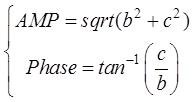 (4)
(4)
4 Data Results
and Validation
4.1 Components of the
Dataset
The content of the dataset is consisted
of three parts, including: (1) the boundary of TPRB (.shp); (2) spatiotemporal
variation data of TWS, including the retrieved water reserves and model results
for comparison (.nc); (3) response data of TWS to ENSO (.nc). The data in (2)
and (3) are archived in fifteen layers and different dimensions (one, two or
three dimension) in NetCDF with monthly data in 1??´1?? spatial resolution. The
detailed description of the dataset is shown in Table 2.
4.2 Data Analysis
Figures 2 (a) and 2 (b) show the spatial
variations of TWS. There is a significant spatial heterogeneity that exhibits a
downward trend in the southwest and an upward trend in the northwest. The most
obvious decline took place in the Nujiang River Basin. The TWS in the headwater
area of the TPRB increased. From 2002 to 2016, the TWS in the TPRB showed an
obvious downward trend with clear characteristics of seasonal variation (Figure
2(c)). From the fluctuation of residuals in TWS, anomalous signals are evident
in the springs of 2003 and 2004 and the winters of 2006 and 2015, which
indicate that drought (flood) disasters occurred in these periods. Figure 3
shows the effect of ENSO on regional water storage. In general, the impact
intensity of ENSO on regional TWSC is 0.95 mm per month, and the response time
lag of TWS to ENSO is 2.72 months. A comparison of Figure 2(a) and Figure 3
shows that the loss of water reserves is more serious in the regions with large
ENSO impacts on TWS, especially in the Nujiang River Basin.
Table 2 Descriptions of the dataset files
|
Data name
|
Data properties
|
Data size
|
|
Variable
|
Time range
|
Frequency
|
Resolution
|
Descriptions
|
|
TPRB.shp
|
-
|
-
|
-
|
-
|
The boundary extracted from SRTM and corrected in the Google Earth platform
|
1.49 MB
|
|
TPRB_TWS_
ENSO_2002-2016.nc*
|
EWT
|
Aug.1, 2002-
Sep.1, 2002
|
monthly
|
1??
|
Gridded equivalent water thickness derived from GRACE
|
208.0 KB
|
|
TWS_grace_t
TWS_noah_t
TWS_cpc_t
|
Aug.1, 2002-
Sep.1, 2002
|
monthly
|
-
|
The temporal TWS derived from GRACE, GLDAS-NOAH, and CPC, respectively,
which are used for analysis and calculation of the double-scale factor
|
|
TWS_gra_trend
TWS_gra_season
TWS_gra_residual
|
Aug.1, 2002-
Sep.1, 2002
|
monthly
|
-
|
The trend, seasonality, and residuals of TWS derived from GRACE
|
|
TWS_rate_spa
|
-
|
-
|
1??
|
The change rate of TWS in the TPRB
|
|
SM
GW
SW
CW
SR
|
Aug.1, 2002-
Sep.1, 2002
|
monthly
|
-
|
The components in TWS. Soil moisture (SM), canopy water (CW), and snow
water (SW) were derived from GLDAS-NOAH[25]; groundwater (GW) was
derived from WGHM[26]; Surface runoff (SR) was derived from GRUN[27]
|
|
enso_amp
|
-
|
-
|
1??
|
Influence magnitude of ENSO on TWS
|
|
enso_phase
|
-
|
-
|
1??
|
The time-lag of influence between ENSO and TWS
|
* The dataset is stored in netCDF format with multiple layers and
different dimensions. The attributes in each layer include unit, description,
reference, etc. The attributes of the dataset include coordinate system,
projection, resolution, processing program, and other related information.
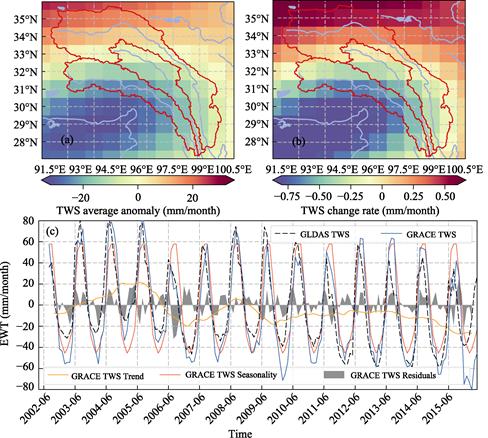
Figure 2 Map of TWS derived from
GRACE. (a) Spatial characteristics of the TWS anomaly; (b) change rate of TWS;
(c) temporal changes in TWS and its components
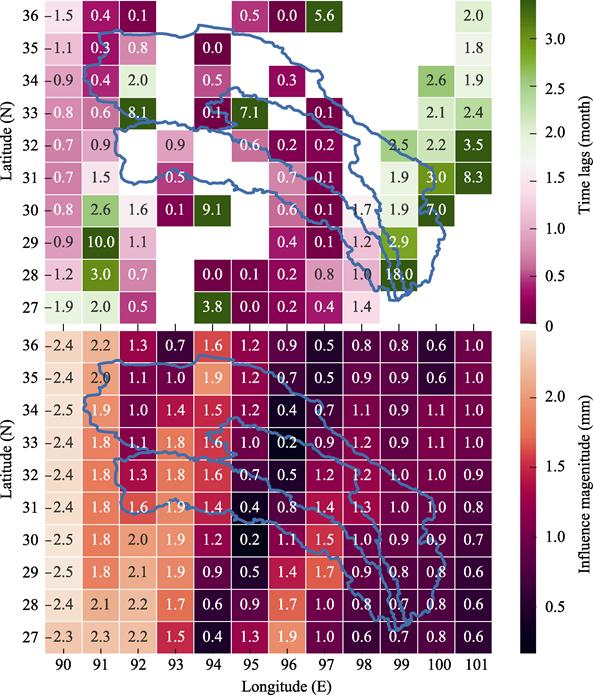
Figure 3 Influence magnitude of ENSO on TWS and
time-lag of the responses
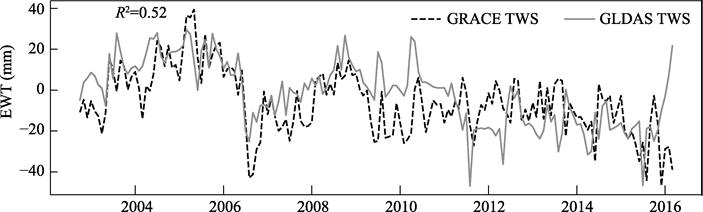
Figure 4 Time variations of non-seasonal TWS
derived from GRACE and GLDAS
4.3 Data Validation
Generally,
the main component of regional water storage is soil moisture. GLDAS presents a
good simulation reflecting soil moisture. We therefore used TWS derived from
GLDAS to validate the TWS derived from GRACE. It can be seen in Figure 4 that
the two time series show good consistency for temporal changes (R2 is 0.86 (P< 0.0001); R2 between time series with seasonal changes removed is
0.52 (P< 0.0001)). In addition,
the station-based TWS calculated from the perspective of water balance was also
used to validate the GRACE TWS. The results showed that the magnitude and
variation trend of the inversion results were consistent with the measured TWS
(see chapter 4.1 in reference [5]), although it is difficult to capture the
small time-varying characteristics in the GRACE TWS.
5 Discussion and Summary
In
this paper, the TWS in the TPRB was derived from GRACE RL06 time-varying gravity
field data. The spatiotemporal characteristics of TWS were decomposed and analyzed
by statistical methods, and the impact of ENSO on the changes of TWS was quantified.
Our research dataset is helpful for the monitoring and research of the water
cycle in this region.
The spatial
resolution of the TWS derived from GRACE is relatively coarse (1 ?? ?? 1 ??),
which is mainly determined by the characteristics of the gravity satellite.
Therefore, although the results in this dataset can better reflect the
variations of TWS, the uncertainty of the results will increase significantly
when analyzing the TWS in a small area. For this situation, our results need to
be evaluated using station observations or meteorological data from
high-resolution satellite observations.
This dataset can simply
reveal water cycle processes in the TPRB and can be used to analyze the causes
of water storage changes in the context of extreme climate events. However, in
high-altitude areas (mainly source areas), due to the uncertainty of the glacier
and snow meltwater, the contribution of each component to the TWS will be
affected. Therefore, the seasonal variations of glacier melt and snowmelt and
the water level change of lakes should be considered when analyzing the TWS
changes over these areas.
This dataset
includes not only the data related to water storage but also the basin boundary
of the TPRB, which could be useful in future studies of this region.
Author Contributions
Liu, S. Y. and Zhu, Y. designed the algorithms and research framework of
the dataset. Yi, Y. contributed to collecting and processing the GRACE solutions.
Xie, F. M. evaluated the data. Zhu, Y. wrote the data paper and Liu, S. Y.
reviewed the paper. The authors declare no conflicts of interest.
Conflicts of Interest
The authors
declare no conflicts of interest.
References
[1]
Luo, Y. H., Zhou, D. Y., Zhu,
R. H., et al. Primary study on environment
of geology and bionomics in the area of world natural inheritance-the three
rivers juxtaposition [J]. Journal of Geological Hazards and Environment
Preservation, 2008, 19(2): 94‒97.
[2]
Chen, X., Jiang, J., Li, H.
Drought and flood monitoring of the liao river basin in northeast China using extended
GRACE data [J]. Remote Sensing, 2018, 10(8): 1168.
[3]
Schumacher, M., Forootan, E.,
Van, D. A. I. J. M., et al. Improving
drought simulations within the Murray-Darling Basin by combined
calibration/assimilation of GRACE data into the WaterGAP Global Hydrology Model
[J]. Remote Sensing of Environment, 2018, 204(1): 212‒228.
[4]
Chen, J. L., Wilson, C. R.,
Tapley, B. D., et al. 2005 drought
event in the Amazon River basin as measured by GRACE and estimated by climate
models [J]. Journal of Geophysical Research, 2009, 114(B5): B05404.
[5]
Zhu Y., Liu S. Y., Yi, Y., et al. Spatiotemporal changes of
terrestrial water storage in three parallel river basins and its response to
ENSO [J]. Mountain Research, 2020, (2): 165‒179.
[6]
Feng, W., Wang, C. Q., Mu, D.
P., et al. Groundwater storage
variations in the North China Plain from GRACE with spatial constrains [J]. Chinese
Journal of Geophysics, 2017, 60(5): 1630‒1642.
[7]
Tapley, B. D., Watkins, M. M.,
Flechtner, F., et al. Contributions
of GRACE to understanding climate change [J]. Nature Climate Change,
2019, 9: 358‒369.
[8]
Zhang, Z., Chao, B. F., Chen,
J., et al. Terrestrial water storage
anomalies of Yangtze River Basin droughts observed by GRACE and connections
with ENSO [J]. Global and Planetary Change, 2015, 126(1): 35‒45.
[9]
Ni, S., Chen, J., Wilson, C.
R., et al. Global Terrestrial Water
Storage Changes and Connections to ENSO Events [J]. Surveys in Geophysics,
2018, 39(1): 1‒22.
[10]
Jin, Z. W., Jin, T. Y.
Correlation between ENSO and Total water storage change anomaly with extreme
weather events over Amazon basin from 2010 to 2016 estimated from GRACE and
hydroclimatic data [J]. Journal of Geodesy and Geodynamics, 2019, 39(2):
93‒97.
[11]
Zhu, Y., Liu, S. Y., Yi, Y., et al. Dataset of terrestrial water
storage and its response to ENSO in the Three Parallel Rivers Basin [J/DB/OL]. Digital Journal of Global Change Data Repository, 2020. https://doi.org/
10.3974/geodb.2020.08.12.V1.
[12]
GCdataPR Editorial Office. GCdataPR data sharing policy [OL]. https://doi.org/10.3974/dp.policy.2014.05
(Updated 2017).
[13]
Dallaire, C. O., Lehner, B.,
Sayre, R., et al. A multidisciplinary
framework to derive global river reach classifications at high spatial
resolution [J]. Environmental Research Letters, 2018, 14(2): 024003.
[14]
Han, S. C., Shum, C. K.,
Jekeli, C., et al. Non-isotropic
filtering of GRACE temporal gravity for geophysical signal enhancement [J]. Geophysical
Journal International, 2005, 163(1): 18‒25.
[15]
Tapley, B. D., Bettadpur, S.,
Watkins, M., et al. The gravity
recovery and climate experiment: Mission overview and early results [J]. Geophysical
Research Letters, 2004, 31(9): L09607.
[16]
Wahr, J., Molenaar, M., Bryan,
F. Time variability of the Earth??s gravity field: Hydrological and oceanic
effects and their possible detection using GRACE [J]. Journal of Geophysical
Research: Solid Earth,
1998, 103(B12): 30205‒30229.
[17]
Longuevergne, L., Scanlon, B.
R., Wilson, C. R. GRACE Hydrological estimates for small basins: Evaluating
processing approaches on the High Plains Aquifer, USA [J]. Water Resources
Research, 2010, 46(11): 6291‒6297.
[18]
Feng, W., Zhong, M., Lemoine,
J. M., et al. Evaluation of
groundwater depletion in North China using the Gravity Recovery and Climate
Experiment (GRACE) data and ground-based measurements [J]. Water Resources
Research, 2013, 49(4): 2110‒2118.
[19]
Swenson, S., Wahr, J.
Post-processing removal of correlated errors in GRACE data [J]. Geophysical
Research Letters, 2006, 33(8): L08402.
[20]
Rojo, J., Rivero, R.,
Romero-morte, J., et al. Modeling
pollen time series using seasonal-trend decomposition procedure based on LOESS
smoothing [J]. International Journal of Biometeorology, 2017,
61(2): 335‒348.
[21]
Sanchez-vazquez, M. J., Nielen,
M., Gunn, G. J., et al. Using
seasonal-trend decomposition based on loess (STL) to explore temporal patterns
of pneumonic lesions in finishing pigs slaughtered in England, 2005-2011 [J]. Preventive Veterinary Medicine, 2012, 104(1/2):
65‒73.
[22]
Cleveland, R. B., Cleveland, W.
S. STL: a seasonal-trend decomposition procedure based on loess [J]. Journal
of Official Statistics, 1990, 6(1): 3‒33.
[23]
Phillips, T., Nerem, R. S.,
Fox-kemper, B., et al. The influence
of ENSO on global terrestrial water storage using GRACE [J]. Geophysical
Research Letters, 2012, 39(16): L16705.
[24]
Salisbury, J. I., Wimbush, M.
Using modern time series analysis techniques to predict ENSO events from the
SOI time series [J]. Nonlinear Processes in Geophysics, 2002, 9(4):
341‒345.
[25]
Rodell, M., Houser, P. R.,
Jambor, U., et al. The global land
data assimilation system [J]. Bulletin of the American Meteorological
Society, 2004, 85(3): 381‒394.
[26]
Döll, P., Schmied, H. M.,
Schuh, C., et al. Global-scale
assessment of groundwater depletion and related groundwater abstractions: combining
hydrological modeling with information from well observations and GRACE
satellites [J]. Water Resources Research, 2015, 50(7): 5698‒5720.
[27]
Ghiggi,
G., Humphrey, V., Seneviratne, S. I., et
al. GRUN: an observations-based global gridded runoff dataset from 1902 to
2014 [J]. Earth System Science Data, 2019, 11(4): 1655‒1674.