In Situ Sample Dataset of Stem Sap Flow of Robinia pseudoacacia Plantation in the
Loess Plateau
Zhang, J.1
Di, L.1* Chen, Z. N.2 Wang, A. M.3 Ni, F.1 Ren, Y. B.4 Fei, J. E.1
Wu, X. Z.5 Wang, Z. G.6
Han, F.3 Ru, H. L.3 Jing, G. Y.1
1. College of Resources and Environmental
Sciences, Gansu Agricultural University, Lanzhou 730070, China;
2. Gansu Research Institute of Forestry Science,
Lanzhou 730020, China;
3. Pingliang Research Institute of Soil and
Water Conservation Science, Pingliang 744000, China;
4. College
of Agriculture and Forestry Science and Technology, Longdong University, Qingyang
745000, China;
5. Lanzhou City University, Lanzhou 730070,
China;
6. Guyuan Branch of Ningxia Academy of
Agriculture and Forestry Science, Guyuan 756000, China;
Abstract: The artificial Robinia
pseudoacacia plantation planted in the middle and late 1970 s was
selected in the Zhonggou River basin (107??30¢E?C107??31¢E, 35??19¢N?C35??20¢N) in the Loess Plateau of Gansu province. According to the
principle of heat balance, the thermal diffusion probe technology was used to
continuously monitor the trunk sap flow of the selected sample trees to obtain
the in situ sample dataset of stem sap flow of Robinia pseudoacacia Plantation on the Loess Plateau. The dataset
includes three tables: sap flow data of 8 Robinia
pseudoacacia plantation in three periods, from May 19 to November 30 in
2017, April 24 to December 13 in 2018, January 13 to December 10 in 2019 (Sap
flow data were sampled every ten minutes). The dataset is archived in .xlsx
data format in one file with data size of 6.59 MB.
Keywords: sap flow; monitoring data; Robinia pseudoacacia; Loess Plateau
1 Introduction
The water balance of forest ecosystem is an important
factor affecting local and global climate. The main part of water transport in
forest ecosystem is transpiration[1]. Transpiration is the main
process of water transport from forest ecosystem to atmosphere, which plays an
important role in the process of water transport from soil, vegetation and
atmosphere[2]. In the forest ecosystem, tree transpiration and
evaporation are the only way for the forest to transport water to the
atmosphere, which account for the largest proportion in the forest water cycle[3].
The water absorbed by roots from the soil is continuously transported to the
canopy layer through the trunk passage, most of which is lost to the atmosphere
through stomata transpiration[4]. Sap flow is the expression form of
transpiration at the level of single tree[5], more than 99.8% of sap
flow is used for transpiration water consumption[6]. It takes on the
soil water absorbed and collected by a huge underground root system, determines
the transpiration of the whole crown, and reflects the water transmission in
plants[7?C8]. Sap flow moves from root to stem and leaf along the
plant conduit, which is very important to maintain the hydrological connection
between soil and atmosphere[9]. It can not only provide oxygen to
xylem parenchyma cells, but also promote nutrient absorption[10].
The main power of its transmission includes root pressure, Cohesion of water
molecules, gravity of water at different heights, and transpiration tension[11].
Therefore, stem sap flow is closely related to the transpiration of plants and
is the most active form of water movement in the SPAC system. Through the
monitoring of stem sap flow, tree transpiration can be estimated, which
provides basic data for the in-depth study of forest hydrology. With the
improvement of trunk sap flow monitoring methods, trunk sap flow has also become
the preferred index for automatic long-term monitoring of plant water status[12?C13].
In recent years, many domestic scholars have carried out
a large number of studies on water consumption characteristics of tree species
in different regions of the Loess Plateau by means of trunk sap flow[14?C15].
In the loess hilly area of Eastern Gansu province, the climate is dry, and the
precipitation distribution is uneven. The forest vegetation coverage is low,
and the soil erosion is serious. The state has successively invested a series
of forestry ecological projects in this area. Among them, the artificial Robinia pseudoacacia forest in the Loess
Plateau is mainly pure forest, which has a single structure and sparse
vegetation under the forest. After large-scale artificial afforestation, it
consumes soil water intensively. In addition, the precipitation cannot
supplement the consumption of soil water in time, resulting in the drying of
the soil under the forest (soil dry layer)[16]. The formation of dry
soil layer weakens the hydrological cycle of the surface ecosystem and has a
negative impact on the healthy development of the current plantation
vegetation, The result is that the plantation of Robinia pseudoacacia will decline in a large area after 30 years[17?C18].
However, because Robinia pseudoacacia
is a typical neophyte, which not only adapts to wet and fertile, but also bears
drought and barren, and grows rapidly. It is a good tree species for
afforestation[19] and has become one of the main tree species for afforestation
of soil and water conservation in the Loess Plateau of China[20]. In
the process of early large-scale construction of artificial forest to implement
vegetation ecological restoration, the local natural environment conditions and
the temporal and spatial distribution characteristics of soil moisture were
ignored, and the selection of tree species was not scientific enough, resulting
in unreasonable forest structure, single tree species, too large planting
density, low survival rate and conservation rate of forest building. Therefore,
it is of great theoretical significance for guiding the restoration and
sustainable development of plantation vegetation to study the ecological and
hydrological process of typical plantation in this area and to understand the
transpiration and water consumption of the region.
2 Metadata of the Dataset
The information of authors, geographical region, data size,
dataset composition, data publishing and sharing service platform, data sharing
policy and other information of the dataset are shown in Table 1[21].
3 Methods
3.1 Study
Area
The study area is located in
Zhonggou River basin (35??19??N?C35?? 20??N, 107??30??E?C107??31??E) of the Loess Plateau of Gansu province, covering an
area of 2.09 km2, with an altitude of 1,072?C1,351 m, which is a typical loess hilly and gully area (Figure 1).
The gully is fully developed, the slope is steep, and the soil erosion is
relatively serious, the erosion modulus is 4,500?C4,800 t??km?C2[23]. The soil parent material is
primary loess and secondary loess, and the typical soil type is black lossiah soil,
yellow loamy soil and brown soil. This region has a typical continental
climates with annual average temperature of 10.7 ??C, annual sunshine hours
of 2,315.4 h, frostless period of 174d, annual average rainfall of 555 mm,
annual evaporation of 1,181.6 mm, dryness of 0.95?C1.28[24].
Table 1 Metadata summary of ??In situ sample dataset of stem
sap flow of Robinia pseudoacacia
plantation in the Loess Plateau??
|
Items
|
Description
|
|
Dataset full name
|
In situ sample dataset of stem sap flow of Robinia pseudoacacia plantation in the
Loess Plateau
|
|
Dataset
short name
|
StemSapFlowR.pseudoacaciaLoessPlateau
|
|
Authors
|
Zhang, J. AAA-5731-2019, Gansu Agricultural University, zhangjun@gsau.edu.cn
|
|
|
Di, L., Gansu Agricultural University,
dili@gsau.edu.cn
|
|
|
Chen, Z. N., Gansu forestry research
institute, chen.zhengni@gmail.com
|
|
|
Wang, A. M., Pingliang Institute of
Soil and Water Conservation, 593928177@qq.com
|
|
|
Ni, F., Gansu Agricultural University,
1356159486@qq.com
|
|
|
Ren, Y. B., Longdong College, 171344121@qq.com
|
|
|
Fei, J. E., Gansu Agricultural
University, 943416926@qq.com
|
|
|
Wu, X. Z., Lanzhou City University, wxz315@163.com
|
|
|
Wang, Z. G., Guyuan Branch of Ningxia
Academy of Agricultural And Forestry Sciences, 1731967640@qq.com
|
|
|
Han, F., Pingliang Institute of Soil
and Water Conservation, 455573021@qq.com
|
|
|
Ru, H. L., Pingliang Institute of
Soil and Water Conservation, 1175332809@qq.com
|
|
|
Jing, G. Y., Gansu Agricultural
University, 960249539@qq.com
|
|
Geographical
region
|
Longdong Loess Plateau Zhonggou
watershed (107??31'E, 35??20'N)
|
|
Year
|
2017, 2018, 2019
|
|
Data format
|
.xlsx
Data size 6.59 MB
|
|
Data files
|
SAP
flow data of 8 sample trees from May 19, 2017 to November 30, 2017; SAP flow
data of 7 sample trees from April 24, 2018 to September 10, 2019, because
the probe of sample trees No.0663 was damaged; SAP flow data of 6 sample
trees from September 11, 2019 to December 10, 2019, because
the probe of sample trees No.0665 was damaged
|
|
Foundations
|
National Natural Science Foundation
of China (41461112, 31660235)
|
|
Data publisher
|
Global Change Research Data
Publishing & Repository, http://www.geodoi.ac.cn
|
|
Address
|
No. 11A, Datun Road, Chaoyang District, Beijing 100101, China
|
|
Data share policy
|
Data from
the Global Change Research Data Publishing & Repository includes
metadata, datasets (data products), and publications (in this case, in the Journal of Global Change Data & Discovery). Data sharing policy includes: (1) Data
are openly available and can be free downloaded via the Internet; (2) End
users are encouraged to use Data subject to citation; (3)
Users, who are by definition also value-added service providers, are welcome
to redistribute Data subject to written permission from the GCdataPR Editorial
Office and the issuance of a Data redistribution license; and (4) If Data
are used to compile new datasets, the ??ten percent principal?? should be
followed such that Data records utilized should not
surpass 10% of the new dataset contents, while sources should be clearly
noted in suitable places in the new dataset [22]
|
|
Communication and searchable system
|
DOI, DCI, CSCD, WDS/ISC, GEOSS,
China GEOSS, Crossref
|
The vegetation was damaged
seriously and the vegetation coverage is low due to the long-term cultivation
and excessive human interference. Since
the middle and late of 1970s, a large area of farmland has been converted to
forest in this area. The existing vegetation has been artificially constructed
in the past 40 years. At present, the forest area covers 5,420 km2
in this region, and 37.13% of forest coverage. Locust is the main tree species
in this area, accounting for 92% of the total forest area. Other afforestation
tree species include Populus davidiana,
Saliz matsudana, Paulownia fortunei, Biota
orientalis and Larix principis-rupprechtii.
There are few undergrowth herbs, mainly including Artemisa vestita, Stipa
breviflora, Hippophae rhamnoides linn,
Bothriochloa ischaemum, Setaria faberii, Lespedeza fioribunda, etc[25].
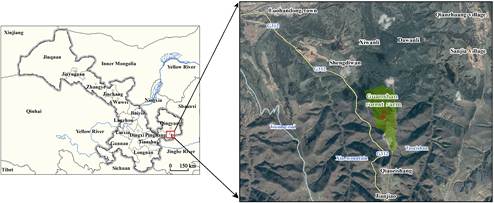
Figure
1 Map of the study area
On the premise of
preliminary investigation in May 2017, standard plots (20 m??20 m) were set up
in typical sections of small watershed to investigate the stands (Table 2). It
was found that the density of 25-year artificial Robinia pseudoacacia with 750 trees??hm?C2 of stand density, and the average height of trees was 14.88 m, the
average DBH was 16.81 cm, and the canopy density was 0.8. Considering the influence of the cable length on the monitoring
results, 8 standard trees with good growth of different diameter grades,
straight and complete trunk and moderate crown are selected as the sample trees
in the relatively concentrated areas in the sample plots (Table 3).
Table 2
Description of sample land
|
Sample
type
|
Stand age
|
Geographic location
|
Landform
|
Aspect
|
Altitude (m)
|
Density (trees??hm?C2)
|
Average DBH (cm)
|
Height (m)
|
Canopy density
|
|
Acacia
plantation
|
25
|
35??20¢41.4²N
107??31¢11.5²E
|
Tableland surface
|
332??
Semi-shady slope
|
1,237
|
750
|
16.81
|
14.88
|
0.8
|
Table 3 The information of the sample plots
|
Sample plots
|
DBH (cm)
|
Height (m)
|
Crown diameter (m)
|
Sapwood thickness (cm)
|
|
0666
|
16.7
|
13.2
|
5.4??5.2
|
1.0
|
|
0662
|
14.2
|
15.1
|
6.5??7.8
|
1.5
|
|
0660
|
12.9
|
16.8
|
6.5??8.4
|
1.6
|
|
0665
|
20.0
|
15.7
|
4.2??5.3
|
1.7
|
|
0658
|
15.2
|
13.9
|
4.2??5.6
|
0.7
|
|
0663
|
17.6
|
16.5
|
5.8??6.3
|
2.3
|
|
0659
|
19.4
|
13.7
|
5.2??6.1
|
2.0
|
|
0664
|
18.5
|
14.2
|
4.5??7.6
|
1.3
|
3.2 Data
Collection
The transpiration of the whole tree
can be estimated by measuring the stem sap flow[26]. Because the sapwood part of a tree is a channel for water
transfer from the root system to the crown, the sap flow through the trunk can
be approximately equal to the transpiration water consumption of the tree
canopy, and the transpiration water consumption of the whole tree can be
obtained by measuring the sap flow of the trunk[4]. At present, stem sap flow has become one of the key indicators
to analyze the water consumption characteristics of trees and study the water
transmission mechanism of trees[27]. Thermal method is an advanced
method to study the water transfer and consumption of plants in the world. It
can realize continuous and automatic monitoring on living fluid flow of the
tree, with high time resolution, generally without damaging the normal
physiological activities of plants, changing the original environment and tree
structure, and has the advantages of simple and economic, repeated monitoring,
and convenient field operation[28]. According to different principles, it can be divided into three
methods: heat pulse velocity method (HPV), stem surface heat balance method
(SHB), thermal dissipation probe method (TDP), laser heat pulse method (LHPG)
and heat deformation method (HFD). The thermal diffusion probe (TDP) method
used in this study can realize automatic data collection with high accuracy and
reliability. Therefore, TDP has become one of the most commonly used research
methods in the research of water consumption of trees.
3.2.1 Working Principle of TDP
 The TDP method is a sap
flow measurement system for sapwood of trees invented by Granier in 1985[29?C30]. A linear heating probe is inserted into the xylem of the trunk,
and the other unheated probe is inserted into the xylem at a certain distance
below it as a reference probe, and the temperature difference between the two
probes is measured. The heat of the heated
probe diffuses upward with the flow of sap, which leads to the cooling of the
heated probe. When the density of trunk sap flow is zero or minimum, the
temperature difference (DT) between the two probes is the largest. With the
increase of SAP density, the thermal conductivity of the xylem will increase,
and the temperature difference between the two probes will decrease.
The TDP method is a sap
flow measurement system for sapwood of trees invented by Granier in 1985[29?C30]. A linear heating probe is inserted into the xylem of the trunk,
and the other unheated probe is inserted into the xylem at a certain distance
below it as a reference probe, and the temperature difference between the two
probes is measured. The heat of the heated
probe diffuses upward with the flow of sap, which leads to the cooling of the
heated probe. When the density of trunk sap flow is zero or minimum, the
temperature difference (DT) between the two probes is the largest. With the
increase of SAP density, the thermal conductivity of the xylem will increase,
and the temperature difference between the two probes will decrease.
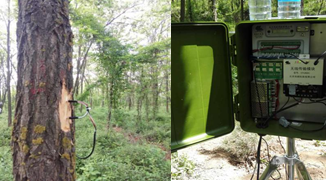
In
Figure 2, TDP probes consists of a pair of cylindrical probes, one installed on
the upper side of the trunk, which is a heating probe (including heating
elements and thermocouples), and the other installed on the lower side of the
trunk, which is a reference probe (only including thermocouples). In this experiment, a 1 cm long thermal
diffusion probe was used to monitor the sap flow density of the outer sapwood
(Figure 2). The distance between the reference probe and the heating probe is
15 cm. A special current regulating device is used to connect the 12 V DC power
to supply a constant current of the heating probe to achieve a continuous
heating of 0.15 w. In order to avoid the measurement error caused by solar
radiation, the probe is installed on the north side of the trunk and covered
with radiation proof aluminum platinum. Rr-1016 data collector is used to
measure and read a group of data every 10 min. The flux density of sap flow is
calculated according to the general Granier empirical formula.
3.2.2 Specific Installation of
Instrument
(1) Trees of different sizes, straight and complete trunk,
non-eccentric and moderate crown was used as the standard sample wood (the trunk
tissue is uniform, no abnormal nodule, no mechanical or biological damage or
other obstacles), and then the thickness of bark and phloem was measured (if
the thickness is not uniform, polish the trunk.).
(2) At the 1.3 m position of the sample tree trunk, a knife was
used to scrape the bark along the vertical direction of the trunk into two 4 ??
5 cm rectangles (to prevent damage to the trunk phloem when scraping the bark).
The upper and lower spacing between the two probes is 10 cm.
(3) Drill two holes with a diameter of 1.5 mm in two
rectangles, and insert the heat source probe and the induction probe into the
upper and lower holes respectively.
(4) The gap between the probe and the trunk was sealed with
glass glue to prevent the impact of rainwater infiltration.
(5) 12 V battery was used to supply power for heater, and solar
panel is installed in the field to connect solar cell controller as standby
charging.
(6) DTU900c data collector was installed at one end of the
probe[4].
3.2.3 Measurement of Trunk Sap
Flow
DTU900c produced by Beijing
Rainroot Scientific Limited has been installed since May 2017. In order to
avoid the measurement error caused by direct sunlight, the probe was evenly
installed on the north side of 1.3 m black locust trunk. Drill a hole with a diameter of 1.5 mm along the distance of 10
cm in the vertical direction of the trunk with a certain specification of drill
bit, and insert the TDP probe. After the probe was fixed, the whole probe and
its adjacent area were covered with radiation proof aluminum foil, and the
upper and lower ends shall be fixed with adhesive tape. The upper end of the
covering layer and the bark shall be sealed with transparent glass glue to
prevent the impact of environmental temperature change and rainwater infiltration
on the measurement results. The automatic weather
station installed in the sample plot was used to collect the effective solar
radiation, air temperature, wind speed, air relative humidity and other
meteorological elements such as soil temperature and soil humidity monitored at
the same time.
4 Results
The data analysis in 2017 showed
that: (1) there was a trend of high in
the day and low in the night in the daily variation of sap flow of Robinia pseudoacacia forest; (2) the
variation of sap flow rate of Robinia
pseudoacacia forest was single peak in sunny days, multi peak (in cloudy
days and irregular fluctuation in rainy days); (3) the monthly mean value of
sap flow rate of Robinia pseudoacacia
forest was low-high-low. The sap flow rate of Robinia pseudoacacia forest in October was the lowest (193.19 g??h?C1), and that in August
was the highest (652.31 g??h?C1); (4) There were significant seasonal differences in the start
time, peak time and decline time of sap flow in different growth periods.
Generally, sap flow starts at about 7:00 in the early growth period and reaches
the peak time at about 13:00, which is one hour behind the middle growth
period. However, sap flow starts at 6:00 in the peak growth period and reaches
the peak value at 11:00?C12:00, and the law of
change in the late growth period is basically the same as that in the early
growth period; (5) the factors influencing sap flow were different in growth
periods, but they were significantly related to air temperature, solar
radiation and air humidity. Other factors have different effects on sap flow
with seasonal changes. Table 4 is an excerpt of
the continuous monitoring data of trunk sap flow on May 19, 2017, in which Fd1
is the monitoring data of No. 666 sample tree, Fd2 is the monitoring
data of No. 662 sample tree, Fd3 is the monitoring data of No. 660
sample tree, Fd4 is the monitoring data of No. 665 sample tree, Fd5
is the monitoring data of No. 658 sample tree, Fd6 is the monitoring
data of No. 663 sample tree, Fd7 is the monitoring data of No. 659
sample tree, and Fd8 is the monitoring data of No. 664 sample tree.
Table 4 The continuous monitoring data of sap
flow on May 19, 2017 (partly)
|
Time
|
Battery voltage (V)
|
Fd1 (??)
|
Fd2 (??)
|
...
|
Fd8 (??)
|
|
2017/5/19 17:30
|
12.899
|
5.101,9
|
5.231,5
|
...
|
5.251,6
|
|
2017/5/19 17:40
|
12.878,9
|
5.110,9
|
5.216,3
|
...
|
5.230,4
|
|
...
|
...
|
...
|
...
|
...
|
...
|
|
2017/5/19 23:40
|
14.201,8
|
5.540,3
|
6.048,1
|
...
|
5.839,9
|
|
2017/5/19 23:50
|
14.201,8
|
5.545,9
|
6.061,0
|
...
|
5.838,2
|
5 Discussion and Conclusion
In this study, TDP was used to
monitor the stem sap flow of Robinia
pseudoacacia Plantation. The effective solar radiation, air temperature,
relative humidity, wind speed and other meteorological factors were monitored
simultaneously. The continuous observation
data for many years can be regarded as an important index data of the regional
ecological environment change and the basic data of vegetation growth and
change analysis. The ranking of influence
of single environmental factor on the sap flow rate in daytime was temperature
(0.839) > relative humidity (-0.747) > solar
radiation (0.721) > vapor pressure deficit (0.718) > wind speed (0.260);
the ranking of influence on the sap flow rate in nighttime was vapor pressure
deficit (0.615) > air temperature (0.608) > relative humidity (-0.505) > wind speed (0.048). The
correlation between solar radiation and sunny and cloudy days was the most
significant (0.837 and 0.855, respectively) (P < 0.01). Under rainy
days, the air temperature was the most significant, and the correlation
coefficient was 0.220 (P < 0.01).
The sap flow rate of the artificial Robinia pseudoacacia forest in the peak growth period showed a
single peak curve trend, with the daily average sap flow rate of 22.09, 22.43
and 20.66 g??h?C1, respectively, and the
daily average sap flow rate of the artificial Robinia pseudoacacia forest in the peak growth period was 17.07 g??h?C1. The sap flow rate per
unit sapwood area was positively correlated with air temperature, solar
effective radiation and water vapor pressure deficit, and negatively correlated
with relative humidity. The absolute value of correlation degree was shown as photosynthetic
effective radiation > water vapor pressure deficit > air temperature >
relative humidity > wind speed. The sap flow rate per unit sapwood area
decreased with the increase of DBH.
Author Contributions
Di, L. designed the algorithms of the dataset. Chen, Z. N., Wang, A. M., Ren, Y. B., Fei, J. E., Wu, X. Z., Wang, Z. G.,
Han, F., Ru, H. L., Jing, G. Y. contributed to the
data processing and analysis. Zhang, J., Di, L. and Ni, F. wrote the data paper.
References
[1]
Sevanto,
S., Nikinmaa, E., Riikonen, A., et al.
Linking xylem diameter variations with sap flow measurements [J]. Plant and Soil, 2008, 305(1/2): 77?C90. DOI: 10.1007/s11104-008-9566-8.
[2]
Han, C., Chen, N., Sun, S., et al.
Research progress on hydrological regulation function and mechanism of forest
ecosystem [J]. Journal of Ecology,
2019, 38 (7): 2191?C2199. DOI:
10.13292/j.1000-4890.201907.019.
[3]
Zhou, X. F.
Forest and Ecological Environment in China [M]. Beijing: China Forestry Press, 1999.
[4]
Zhang, J.
G. Transpiration characteristics of two typical forest communities in loess hilly
area [D]. Yangling: University of Chinese Academy of Sciences (Research Center
for soil and water conservation and ecological environment, Ministry of
education, Chinese Academy of Sciences), 2014.
[5]
Daley, M. J., Phillips, N. G. Interspecific variation in nighttime
transpiration and stomatal conductance in a mixed New England deciduous forest
[J]. Tree Physiology, 2006, 26(4):
411?C419. DOI: 10.1093/treephys/26.4. 411.
[6]
Sui, X. H.
Study on transpiration characteristics of main tree species in the west loess
region [D]. Beijing: Beijing Forestry University, 2011.
[7]
Nadezhdina,
N. Sap flow index as an indicator of plant water status [J]. Tree Physiology, 1999, 19(13): 885?C891. DOI: 10. 1093/treephys/19.14.960.
[8]
Cohen, M.
E., Goldhamer, D. A., Fereres, E., et al.
Assessment of peach tree responses to irrigation water deficits by continuous
monitoring of trunk diameter changes [J]. Journal
of Horticultural Science & Biotechnology,
2001, 76(1): 55?C60.
[9]
Steppe, K.,
Vandegehuchte, M. W., Tognetti, R., et al.
Sap flow as a key trait in the understanding of plant hydraulic functioning
[J]. Tree Physiology, 2015, 35(4):
341?C345. DOI: 10. 1093/treephys/tpv033
[10] Hubbart, J. A., Kavanagh, K. L., Pangle, R., et al. Cold air drainage and modeled
nocturnal leaf water potential in complex forested terrain [J]. Tree Physiology, 2007, 27(4): 631?C639. DOI: 10.1093/treephys/27.4.631.
[11] Li, S. Z, Zheng, H. Z., Chen, J. M., et al. Effects of environmental factors
on trunk sap flow [J]. Anhui Agricultural
Science, 2008, 36(25): 10758?C10759, 10762. DOI:
10.3969/j.issn.0517-6611.2008.25.015.
[12] Nadezhdina, N. Sap flow index as an indicator of
plant water status [J]. Tree Physiology,
1999, 19(13): 885?C891. DOI:
10.1093/treephys/19.14.960.
[13] Yu, M. K., Jiang, Z. L., Lu, X. Z., et al. Study on the dry sap flow of
torch pine [J]. Nanjing Forestry University
(Natural Science Edition), 2003,
27(3): 7?C10. DOI:
10.3969/j.issn.1000-2006.2003.03.002.
[14] Wang, J. X., Huang, B. L., Wang, M. C., et al. Correction of transpiration water
consumption and soil water stress of Platycladus
orientalis and Robinia pseudoacacia
saplings under different water supply conditions [J]. Journal of Applied Ecology, 2005, 16(3): 419?C425.
[15] Zhou, H. G., Liu, G. Q.,
Jiao, X., et al. Characteristics of
transpiration and water consumption of several trees in the water and wind
erosion complex area of the Loess Plateau [J]. Journal of Ecology, 2008, 28(9): 4568?C4574.
[16] Jia, X. X., Shao, M. A., Zhu, Y. J., et al. Soil moisture decline due to
afforestation across the Loess Plateau, China [J]. Journal of Hydrology, 2017, 546: 113?C122. DOI: 10. 1016/j.jhydrol.2017.01.011.
[17] Du, S., Wang, Y. L., Kume, T., et al. Sap flow characteristics and
climatic responses in three forest species in the semiarid Loess Plateau region
of China [J]. Agricultural and Forest
Meteorology, 2011, 151(1): 1?C10. DOI:
10.1016/j.agrformet.2010.08.011.
[18] Ma, C., Luo, Y., Shao, M. A., et al. Environmental controls on sap
flow in black locust forest in Loess Plateau, China [J]. Scientific Reports, 2017, 7(1): 13160. DOI: 10.1038/s41598-017-13532-8.
[19] Yu, D. J. The first volume of Chinese tree
records published [J]. Forestry science,
1985, 21(2): 225?C226.
[20] Ma, C. K. Study on eco hydrological process of
artificial Robinia pseudoacacia
forest land in the Loess Plateau [D]. Yangling: Northwest Agricultural and
Forestry University of Science and Technology, 2018.
[21] Zhang, J., Di, L., Chen,
Z. N., et al. Dataset of stem sap
flow of Robinia pseudoacacia
Plantation in the Loess Plateau (2017?C2019) [DB/OL]. Global Change Data
Repository, 2019. DOI: 10.3974/geodb.2019.06.17.V1.
[22] GCdataPR Editorial Office.
GCdataPR data sharing policy [OL]. DOI: 10.3974/dp. policy.2014.05 (Updated
2017).
[23] Jing, G. Y. Study on the ecological and
hydrological functions of the litter layer and soil layer of the artificial Robinia pseudoacacia forest in the Loess
Plateau of Longdong [D]. Lanzhou: Gansu Agricultural University, 2017.
[24] Wang, A. M., Ren, Y., Wang,
Y. H., et al. Canopy interception
effect of three diameter class Robinia pseudoacacia Forests in Jingchuan, Gansu
[J]. Forestry Science, 2014, 50(3):
16?C21. DOI: 10.11707/j.1001-7488.20140303.
[25]
Han, F., Ren, Y., Wang, Y. H., et
al. Response of throughfall of Robinia pseudoacacia forest in Jingchuan,
Gansu province to rainfall [J]. People??s Yellow River, 2015, 37(7): 90?C94. DOI: 10. 3969/j. issn.1000-1379.2015.07.023.
[26] Wang, S., Fan, J. Application of three methods
combination of thermal pulse technology in measuring trunk sap flow [J]. Journal of Applied Ecology, 2015, 26(8):
2244?C2252.
[27] Yin, G. C., Zhou, G. Y., Wang, X., et al. Study on the liquid flux of
eucalyptus plantation using thermal pulse system [J]. Journal of Ecology, 2003, 23(10): 1984?C1990. DOI: 10. 3321/j.issn:1000-0933.2003.10.005.
[28] Edwards, W., Booker, R. E. Radial variation in
the axial conductivity of populus and its significance in heat pulse velocity measurement
[J]. Journal of Experimental Botany, 1984,
35(153): 551?C561.
[29] Granier, A. Une nouvelle m??thode pour la mesure
du flux de s??ve brute dans le tronc des arbres [C]. Annales des Sciences
foresti??res, EDP Sciences, 1985, 42(2): 193?C200.
[30] Granier, A. Sap flow measurements in Douglas-fir
tree trunks by means of a new thermal method [J]. Annales des Sciences Forestieres, 1987, 44(1): 1?C14.