Farmland Productive Capacity Dataset in the Surrounding Area of Tai Lake (1985-2010)
Pan, P. P.1,2* Zhao, Q. S1,2 Wang, X. X.3 Ge, J. F.1,2 Yang, G. S.4
1. College of Resources and Environment Science, Hebei Normal University, Shijiazhuang 050024, China;
2. Hebei Key Laboratory of Environmental Change and Ecological Construction, Shijiazhuang 050024, China;
3. Hebei Urban and Rural Planning Institute, Shijiazhuang 050021, China;
4. Nanjing Institute of Geography and Limnology, Chinese Academy of Sciences, Nanjing 210008, China
Abstract: The surrounding area of Tai Lake is recognized as the economic developed and high grain yield area of China. Integrating the satellite data (TM), meteorological data, farmland use data, soil monitoring data and the field survey data, the farmland productive capacity dataset in the surrounding area of Tai Lake (1985-2010) was developed using the Agro-Ecological Zones (AEZ) model. The dataset is consisted of the following data files: (1) boundary data covering the study area; (2) farmland distribution data in 1985, 2000, 2010; (3) farmland changes data from 1985 to 2010; (4) farmland productive capacity distribution data in 1985, 2000, 2010; (5) farmland productive capacity classification data in 1985, 2000, 2010; (6) productive capacity classification data in the farmland change area from 1985 to 2010. The spatial resolution in each of the files is 250 meters. The dataset is archived in .tif and .shp formats, with the data size of 104 MB.
Keywords: Tai Lake; farmland change; productive capacity; AEZ model
1 Introduction
Farmland is an important component of social and economic sustainable development since it is the most basic resource for human survival and societal development[1–2]. Farmland productive capacity (FPC), which is directly related to food security, is the potential productivity of farmland using current levels of tillage technology and corresponding farm management[3] and as such, FPC encompasses natural, societal and economic attribute. Although natural attribute forms the basis of achieving FPC, it is the coordination and interaction between natural and societal attribute that facilitates improvement in FPC. However, FPC changes continually due to influences of natural and socio-economic factors[4].
Here, we selected the study area of Tai Lake and its surrounding area, which is recognized as an area of economic developed and high grain yield in China. Using multiple sources of data, we compiled an FPC dataset in order to carry out a system analysis on the distribution characteristics and temporal and spatial variation in the area, and an FPC classification was then made as a tool for strategic decision making involving sustainable socio-economic development and national and regional food security. We used a range of data covering the period 1985-2010, including remote sensing data, meteorological data, soil census and monitoring data derived from local soil fertilizer stations and field soil monitoring points, farmland soil survey data, 30 m resolution digital elevation model (DEM) data based on remote sensing inversion, and field survey data, within an Agro-Ecological Zones (AEZ) model.
2 Metadata of Dataset
The metadata of the FPC dataset[5] in the Tai Lake area are summarized in Table 1.
Table 1 Metadata summary of the FarmlandAEZdataTaiLake1985_2010 dataset
|
Items
|
Description
|
|
Dataset full name
|
Farmland productive capacity dataset in the surrounding Tai Lake area (1985-2010)
|
|
Dataset short name
|
FarmlandAEZdataTaiLake1985_2010
|
|
Authors
|
Pan, P. P. S-5072-2016, Hebei Normal University, panpeipei626@163.com
Zhao, Q. S. V-5239-2017, Hebei Normal University, 407674049@qq.com
Wang, X. X. S-6861-2017, Hebei Urban and Rural Planning Institute, 18931179072@163.com
Ge, J. F. S-6967-2017, Hebei Normal University, gejingfeng@hebtu.edu.cn
Yang, G. S. S-6978-2017, Nanjing Institute of Geography and Limnology, Chinese Academy of
Sciences, gsyang@niglas.ac.cn
|
|
Geographical region
|
30°7′19″N-32°14′56″N, 119°3′1″E-121°54′26″E
|
|
Year
|
1985-2010
|
|
Temporal resolution
|
Yearly
|
|
Spatial resolution
|
250 m
|
|
Data format
|
.tif, .shp
|
Data size
|
104 MB
|
|
Data files
|
The dataset is consisted of the following data files: (1) boundary data covering the study area; (2) farmland distribution data in 1985, 2000, 2010; (3) farmland changes data from 1985 to 2010; (4) farmland productive capacity distribution data in 1985, 2000, 2010; (5) farmland productive capacity classification data in 1985, 2000, 2010; (6) productive capacity classification data in the farmland change area from 1985 to 2010
|
|
Data publisher
|
Global Change Research Data Publishing & Repository, http://www.geodoi.ac.cn
|
|
Address
|
No. 11A, Datun Road, Chaoyang District, Beijing 100101, China
|
|
Data sharing policy
|
Data from the Global Change Research Data Publishing & Repository includes metadata, datasets (data products), and publications (in this case, in the Journal of Global Change Data & Discovery). Data sharing policy includes: (1) Data are openly available and can be free downloaded via the Internet; (2) End users are encouraged to use Data subject to citation; (3) Users, who are by definition also value-added service providers, are welcome to redistribute Data subject to written permission from the GCdataPR Editorial Office and the issuance of a Data redistribution license; and (4) If Data are used to compile new datasets, the ‘ten per cent principal’ should be followed such that Data records utilized should not surpass 10% of the new dataset contents, while sources should be clearly noted in suitable places in the new dataset[6]
|
3 Methods
3.1 Research Ideas
The FPC dataset was constructed by interpreting remote sensing data and extracting farmland distribution and change data (1985 to 2010); FPC was calculated by using the Agro-Ecological AEZ model; FPC classification was also assessed. We used a spatial resolution of 250 m and all research data were converted to the same coordinate system and projection with land use data.
3.2 Data Collection
Details of the basic data used in this study are presented in Table 2.
Table 2 Basic data in surrounding area of Tai Lake
|
Data Sources
|
type of data
|
Time
|
Resolution
|
Data size
|
|
Data Center for Resources and Environmental Sciences, Chinses Academy of Sciences[8]
|
Land use data
|
1985, 2000
|
1∶100,000
|
36.6 MB
|
|
Data Center of Lake Basin Integration and Simulation, Chinses Academy of Sciences
|
Land use data
|
2010
|
1∶100,000
|
184 MB
|
|
Weather station
|
Meteorological data
|
1980-2010
|
10 years
|
1.8 MB
|
|
Second soil census
|
meteorological data
|
1979-1985
|
1∶1,000,000
|
1.4 MB
|
|
Computer Network Information Center, Chinses Academy of Sciences[9]
|
DEM
|
Around 2000
|
30 m
|
521 MB
|
|
Statistical Yearbook
|
Statistics data
|
1985, 2000, 2010
|
County
|
4 MB
|
Table 3 List of landsat data
|
Time
|
Sensor
|
Resolution
|
Data collection date
|
Path
|
Row
|
The number of bands
|
|
1985
|
TM
|
30 m
|
09-03-1985
|
118
|
38/39
|
7
|
|
17-04-1985
|
119
|
38/39
|
7
|
|
07-03-1985
|
120
|
37/38
|
7
|
|
24-04-1985
|
120
|
39
|
7
|
|
2000
|
ETM+
|
30 m
|
26-03-2000
|
118
|
38/39
|
8
|
|
17-03-2000
|
119
|
38/39
|
8
|
|
24-03-2000
|
120
|
37/38
|
8
|
|
08-03-2000
|
120
|
39
|
8
|
|
2010
|
TM
|
30 m
|
10-02-2010
|
118
|
38/39
|
7
|
|
08-02-2010
|
120
|
37/38/39
|
7
|
|
06-04-2010
|
119
|
38/39
|
7
|
Monthly sunshine duration, temperature, and precipitation data were obtained from 18 weather stations, including 16 national weather stations, Yixing weather station, and Wuxi field observation Station, and used to calculate the annual meteorological data from 1985 to 2010. The meteorological data were processed as raster data matching within a spatial database, however, due to the small number of observational stations, solar radiation was calculated by climatological methods and the empirical coefficient was chosen by considering existing studies in this area[7]. Photosynthetic potential production was calculated from solar radiation data.
We revised soil data where local soil properties varied widely, based on the second soil census and farmland soil survey data, land use characteristics, soil types, and topographical distribution data. Soil indicators included soil organic matter, soil total nitrogen, soil available phosphorus, soil bulk density, soil pH, and soil texture. The ASTER GDEM were from NASA, USA.
Farmland input and management data were derived from socio-economic statistics from the China Economic and Social Development Statistical Database and Statistical Yearbook for different regions.
3.3 Methods
Calculation of FPC varies between models and here model selection was based on regional characteristics and model applicability. We selected the AEZ model for this study[10]. The AEZ model is rigorous since it contains many parameters, including light, temperature, water, soil and input intensity. Calculations for photosynthetic and production potential productivity, light and temperature potential productivity, climate potential productivity, (light, temperature, and precipitation), and FPC follow the step-by-step correction method. The data used in the AEZ model calculations included meteorological data, soil data, DEM data and farmland inputs and management data.
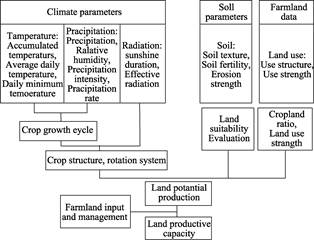
Figure 1 AEZ model structure
3.4 AEZ Model Simulation
Data for sunshine duration, temperature, and precipitation were used to populate the AEZ model and then calculate photosynthetic, light and temperature, and climate production potential productivity.FPC for the study area was calculated as the product of climate potential productivity and soil availability coefficient.
We based the calculation of the coefficient of soil availability on previous and existing studies in this area and evaluated the index system of farmland quality based on expert opinion, theoretical analysis, and farmland characteristics of the study area. The soil availability calculations included site conditions, nutrient status, and physical and chemical properties of topsoil using indicators of DEM, irrigation guarantee rate, soil organic matter, soil total N, soil available phosphorus, soil texture, soil pH, and soil bulk density. We compared the importance of each factor by constructing a judgment matrix and performing linear fitting analysis in the AHP model to calculate the weight of each factor. Scientific and practical expert knowledge and experience in soil science and geography was applied in this process to make the results more systematic. The weight of each factor is shown in Table 4.
Table 4 Evaluation index and weight of soil availability coefficient
|
Target
|
Guidelines
|
Weight
|
Index
|
Weight
|
|
Soil availabi-
lity coefficient
|
Site conditions
|
0.320,2
|
DEM
|
0.106,7
|
|
Irrigation guarantee rate
|
0.213,4
|
|
Nutrient status
|
0.400,9
|
Soil organic matter
|
0.233,0
|
|
Soil total N
|
0.094,5
|
|
Soil available Phosphorus
|
0.073,5
|
|
Physical and chemical properties
|
0.278,9
|
Soil texture
|
0.133,3
|
The indicators of the soil availability coefficient were standardized using different methods according to their weighting (Table 5). The normalized values were proportional to the soil availability coefficient and ranged from 0 to 100, while the scores corresponded to the significant range of the evaluated factors.
Table 5 Standardization of evaluation factors
|
Evaluation index
|
Standardization method
|
|
pH
|
x>9.5or x <4
|
8.5< x≤9.5
|
8< x≤8.5
|
7.5< x≤8
|
6.5< x≤7.5
|
5< x≤6.5
|
4< x≤5
|
|
Normalized value
|
0
|
‒70x+665
|
‒40x+410
|
‒20x+250
|
100
|
20x‒30
|
70x‒280
|
|
Soil organic matter
|
x >2.5
|
1.5< x≤2.5
|
0.8< x≤1.5
|
0< x≤0.8
|
|
|
|
|
Normalized value
|
100
|
20x+50
|
(300x+110)/7
|
62.5x
|
|
|
|
|
Soil bulk density Normalized value
|
|
|
Soil texture
|
Heavy clay
|
clay(sandy loam)
|
(powder) clay
|
soil
|
sand soil
|
|
|
|
Normalized value
|
50
|
80
|
90
|
100
|
45
|
|
|
|
Soil total N
|
x >1
|
0.8< x≤1
|
0.6< x≤0.8
|
0.4< x≤0.6
|
0.2< x≤0.4
|
≤0.2
|
|
|
Normalized value
|
100
|
90
|
80
|
60
|
50
|
40
|
|
|
Available phosphorus
|
x >40
|
20< x≤40
|
10< x≤20
|
5< x≤10
|
3< x≤5
|
0< x≤3
|
|
|
Normalized value
|
100
|
90
|
80
|
60
|
50
|
40
|
|
|
DEM
|
‒10< x≤10
|
‒15< x≤‒10 or 10< x≤20
|
‒20< x≤‒15 or 20< x≤30
|
x>30 or
x <‒20
|
|
|
Normalized value
|
100
|
70
|
50
|
20
|
|
|
Irrigation guarantee rate
|
x >95
|
90< x≤95
|
85< x≤90
|
80< x≤85
|
75< x≤80
|
65< x≤75
|
x≤65
|
|
value
|
100
|
90
|
80
|
65
|
55
|
45
|
40
|
Note: The value intervals or sub-intervals of each parameter differed due to the variation in range and sensitivity of the parameters to the soil effectiveness coefficient.
4 Results and Validation
4.1 Data Products
The dataset[11] consists of: (1) boundary data covering the study area; (2) farmland distribution data in 1985, 2000, and 2010; (3) farmland changes data from 1985 to 2010; (4) FPC distribution data in 1985, 2000, and 2010 (Figure 2 ); (5) FPC classification data in 1985, 2000, and 2010; (6) productive capacity classification data in the area of farmland changes from 1985 to 2010 (Figure 3).
The dataset shows FPC of the study area ranged from 16,214.3 kg hm-2 to 2236.5 kg hm-2 and this variation between areas with high and low values was due to differences in natural environment and level of cultivation. The areas with high values were located in the east, and the areas with low values were located in the western hills and mountains.
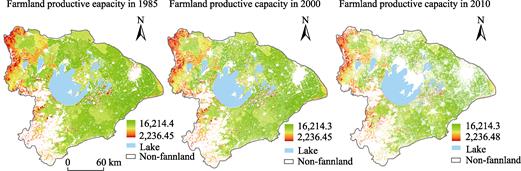
Figure 2 Data maps of FPC distribution in 1985, 2000, 2010[11]
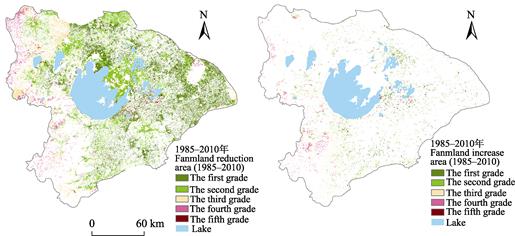
Figure 3 Data maps of productive capacity classification data in the farmland change area (1985-2010) [11]
In areas where farmland decreased over the study period (Figure 3)[11], high-yielding farmland was found to be more widely distributed and the concentration of farmland patches was higher. Reduction in farmland occurred in the eastern area where its quality is good. Where the area of farmland increased, the patches were fragmented at low densities; new patches of farmland were scattered around towns and more remote mountainous areas and were characterized by low levels of FPC. Changes in farmland use showed a sharp drop in high-yielding land and a slow increase in low-yielding land as a result of an imbalance in the increase and decrease of high and low-yielding farmland over the study period. The proportion of decrease in high-yielding farmland was greater than the increase and the proportion of increase in low-yielding farmland was greater than the decrease. In the areas where farmland decreased and increased, high-yielding land accounted for 78.32% and 53.46%, respectively.
Moderately-yielding land accounted for 15.02% and 23.78% in areas of farmland decrease and increase, respectively, while low-yielding land accounted for 6.7% and 22.77%, respectively.
4.2 Validation
Productive capacity is the potential output of farmland and is difficult to verify in the field. However, farmland reductive capacity reflects the grain output level per unit area and may be used as a surrogate measure of FPC. We used the average grain yield to verify the average FPC per county and to verify whether the FPC reflected current grain yields, ArcGIS regional statistical module was used to calculate the average productive capacity in each county and analyze the relationship between FPC and grain yield per hectare. The biaxial curve of FPC and grain yield per hectare (Figure 4) shows that the trends were broadly similar, where the peaks and troughs, and patterns of change are comparable. This indicates that FPC calculated in this study reflected the differences in farmland grain capacity in the study area and vice versa. Actual grain yield is affected by farming conditions, input and management, style and degree of utilization, resulting in a gap between grain yield per hectare and FPC.
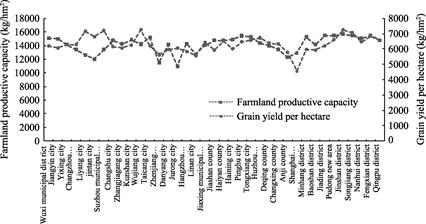
Figure 4 Biaxial curve of FPC and grain yield per hectare
5 Discussion and Conclusion
The FPC dataset in the area surrounding Tai Lake forms a basis for understanding spatio-temporal variation in FPC and the status of farmland. FPC simulation highlights restrictions and potential benefits of farmland in sustainable development and our results showed that hydrothermal conditions and the level of productivity were high. Over the study period of 1985-2010, the distribution of high-yielding farmland and level of FPC reduced significantly as a result of rapid economic development. We suggest that the protection of farmland resources is essential in the context of effective socio-economic and environmental sustainable development.
Author Contributions
Pan, P. P. designed the study and wrote the paper; Zhao, Q. S. contributed to the computer graphics and wrote the paper; Wang, X. X. completed the data processing and analysis. Ge, J. F. and Yang, G. S. were responsible for data validation and paper revision.
References
[1] Yang, H., Li, X. B. Cultivated land and food supply in China [J]. Land Use Policy, 2000, 17(2): 73-88.
[2] Wu, M. Q., Chen, X. G. Changes in arable land area in Qinzhou city and its driving force based on the principle component analysis [J]. Scientia Geographica Sinica, 2014, 34(1): 54-59.
[3] Li, X. X., Yin, Z. D., He, C. G. Review on the study of land potential productivity [J]. Journal of Soil and Water Conservation, 2001, 15(5): 33-36.
[4] Zhang, L. F. Discussion on exploitation and sustainable development [J]. Journal of Agricultural University of Hebei,1999, 22(1): 6-8.
[5] Pan, P. P., Wang, X. X., Ge, J. F., et al. Farmland productive capacity dataset in the surrounding Tai Lake area (1985-2010) [DB/OL]. Global Change Research Data Publishing & Repository, 2016. DOI: 10.3974/geodb.2016.09.05.V1.
[6] GCdataPR Editorial Office. GCdataPR Data Sharing Policy [OL]. DOI: 10.3974/dp.policy.2014.05 (Updated 2017).
[7] Zhang, Y. L., Qin, B. Q., Chen, W. M., et al. Climatological calculation and characteristic analysis of global radiation over wuxi region [J]. Journal of Applied Meteorological Science, 2003, 14(3):339-347.
[8] Liu, J. Y., Liu, M., Zhuang, D., et al. Study on spatial pattern of land-use change in China during 1995-2000 [J]. Science in China (Series D), 2003, 46(4): 1373-384.
[9] ASTER GDEM. http://reverb.echo.nasa.gov/reverb/.
[10] Albersen, P., Fischer, G., Keyzer, M., et al. Estimation of Agricultural Production Relations in the LUC
Model for China [M]. Vienna, Remaprint, 2002: 5-9.
[11] Pan, P. P., Yang, G. S., Su, W. Z., et al. Impact of land use change on cultivated land productivity in Taihu Lake basin [J]. Scientia Geographica Sinica, 2015, 35(8): 990-998. DOI: 10.13249/j.cnki.sgs.2015.08.008.