The Area Dynamics of Taro Co Lake in Tibet: A
Time Series Dataset (1975‒2020)
Zeng, L.
Niu, X. J.* Li, L.
Climate Centre of Tibet Autonomous region, Lhasa 850000,
China
Abstract: The magnitude
and intensity of climate change on the Tibetan plateau are higher than that of the
global average. Lakes are
important sources of surface water and they are relatively sensitive to climate
fluctuations. Taro Co is
situated at the northern foot of the Kailas Range in the Tibetan Plateau
hinterland, with a geographic position between 31??03??N-31??13??N and
83??55??E- 84??20??E, Taro Co is located at an altitude of about 4,566 m and has an area
of about 486 km2. The authors developed a
dataset concerning the area dynamics of Taro Co spanning 26 years from 1975 to 2020.
The dataset is based on a series of reference maps and Landsat images, as well
asGF series satellite images from 1976 to 2020. The boundary data and areas of
the lake in each year were developed according to people-machine interactive
interpretations. The spatial
resolution of the data is 30 m, the dataset format is .shp, and the data size
is 768 KB (compressed to 531 KB in one file). The water area of Taro Co over
time is shown to first decrease and then increase, with water expansion mainly
distributed in the eastern and southwestern regions.
Keywords: Tibetan Plateau; Taro Co; Area dynamics; Long time series; Climate
change
Dataset Availability Statement:
The dataset supporting this paper was published and is accessible
through the Digital
Journal of Global Change Data Repository at:
https://doi.org/10.3974/geodb.2021.01.09.V1.
1 Introduction
The
magnitude and intensity of climate change on the Tibetan Plateau are higher
than the global average[1], with a mean temperature increase of 0.3?C0.4 ??C
per decade[2]. Indeed, this area is known as a ??driver?? and
??amplifier?? of global climate change[3]. As an important source of
surface water, lakes are more obviously affected by climate change and more sensitive
to climate change fluctuations[4], which is important for revealing
global changes and regional response characteristics[5,6]. As one of
the most lacustrine areas in China, the Tibetan Plateau has more than 1,000
salt and freshwater lakes with an area of more than 1.0 km2[7].
Some data show that seven of the world??s warmest years were recorded in the
last decade[8], with warming triggering accelerated glacier melting,
permafrost melting, and other water resource changes, sparking widespread
concern about lakes on the Tibetan Plateau[9]. Most of the lakes are
far away from the disturbing influence of human activities like agriculture and
industry, and thus the changes in their area and water volume are mainly in response to changes in natural environmental factors
and anthropogenic climate change[10]. In view of this, the establishment of a long time
series lacustrine dataset is important for research into global and regional
climate change, including mitigation and adaptation strategies.
The Taro Co is
located in the southwest of the Tibetan Plateau, on the northern slope of the Kailas Range with a geographical location between 31??03??N-31??13??N and 83??55??E-84??20??E. The elevation of the lake water level is about 4,566 m and the maximum
water depth is about 132 m[11]. The basin area of Taro Co is 487.6 km2,
and the catchment area is 6,929.4 km2[12]. The main recharge source
is Budo River, which originates from the glacial meltwater of the Kailas Range[13]. The basin is located in an
alpine semi-arid region, with an average annual precipitation of about 200 mm
and an average annual temperature of 0?C2 ºC[12].
The vegetation types are mainly alpine grasslands and alpine meadows[14].
2 Metadata of
the Dataset
The
metadata of the Taro Co changes dataset (1975-2020)[15] are summarized in
Table 1. They include the full dataset name, short
name, authors, data year, temporal resolution, spatial resolution, data format,
data size, data files, data publisher, and data sharing policy, etc.
Table 1 Metadata summary of the Taro Co changes dataset (1975-2020)
|
Items
|
Description
|
|
Dataset full name
|
Taro Co changes
dataset (1975?C2020)
|
|
Dataset short name
|
TaroCo_1975-2020
|
|
Authors
|
Zeng, L.,
Climate Centre of Tibet Autonomous region, 979952727@qq.com
Niu, X. J.,
Climate Centre of Tibet Autonomous region, niuxj2014@126.com
Li, L., Climate
Centre of Tibet Autonomous region, 493710564@qq.com
|
|
Year
|
1975‒2020
|
|
Time resolution
|
Every 6 years on
average before 2000 and annually after 2000
|
|
Spatial
resolution
|
30 m
|
Data format .shp
|
|
Data size
|
768 KB (531 KB after compression)
|
|
Composition of
dataset
|
Vector boundary
and area data of Taro Co for a total of 26 years: 1975, 1977, 1988,
1990, 1996, 2000‒2020
|
|
Foundations
|
Ministry of Science and Technology of P. R. China (2019QZKK0105- 06);
National
Natural Science Foundation of China (41165002); Tibet Autonomous Region
(XZ202001ZY0023N)
|
|
Data computing
environment
|
PIE Basic 6.0
Trial Version, ArcGIS 10.4 Trial Version
|
|
Data publisher
|
Global Change
Research Data Publishing & Repository, http://www.geodoi.ac.cn
|
|
Address
|
No. 11A, Datun
Road, Chaoyang District, Beijing 100101, China
|
|
Data sharing
policy
|
Data from the Global Change
Research Data Publishing & Repository includes metadata, datasets (in the Digital Journal of Global Change Data Repository), and
publications (in the Journal of Global Change Data & Discovery). Data
sharing policy includes: (1) Data are openly available
and can be free downloaded via the Internet; (2) End users are encouraged to
use Data subject to citation; (3) Users, who are by definition
also value-added service providers, are welcome to redistribute Data subject
to written permission from the GCdataPR Editorial Office and the issuance of
a Data redistribution license; and (4) If Data are
used to compile new datasets, the ??ten per cent principal?? should be followed
such that Data records utilized should not surpass 10% of the
new dataset contents, while sources should be clearly noted in suitable
places in the new dataset[16]
|
|
Communication and
searchable system
|
DOI, DCI, CSCD, WDS/ISC, GEOSS, China GEOSS, Crossref
|
3 Methods
3.1 Data Sources
The lakes
on the Tibetan plateau show obvious fluctuations due to intra-annual variations
of precipitation, glacial meltwater, and evaporation. The image data selected
in the construction of the dataset mainly focus on October and November of each
year when the lake area is relatively stable. The selected remote sensing
images are of good quality with cloud coverage never exceeding 5%. The data sources
include a 1:100,000 topographic map data in 1975, 30 m DEM, Landsat MSS data,
Landsat TM data, Landsat ETM data obtained from Geospatial Data Cloud1,
and GF1-WFV data acquired by the China Resources Satellite Application Center2
(Table 2).
Table 2 List of the data sources
|
Data Type
|
Description
|
|
DEM
|
ASTER GDEM data were jointly
developed by METI (Japan) and NASA (USA), and are generated based on
??Advanced Spaceborne Thermal Emission and Anti-Radiometer (ASTER)?? data
computation. They are obtained from the Geospatial Data Cloud with a resolution
of 30 m
|
|
Topographic map
|
1975 topographic
map data with a resolution of 1:100,000
|
|
Landsat MSS
|
Includes data for May 15, 1977
(strip: 153, row: 38), acquired from the Geospatial Data Cloud with a
resolution of 60 m
|
|
Landsat TM
|
Includes data for December 6,
1988, June 3, 1990, October 9, 1996, November 11, 2008, October 13, 2009,
October 16, 2010, and November 4, 2011 (strip: 142, row: 38), acquired from
the Geospatial Data Cloud with a resolution of 30 m
|
|
Landsat ETM
|
Includes data for October 28,
2000, October 30, 2001, December 5, 2002, October 21, 2003, November 24,
2004, November 11, 2005, October 13, 2006, November 17, 2007, and November
14, 2012 (strip number: 142, line number: 38), acquired from the Geospatial
Data Cloud with a resolution of 30 m
|
|
GF1-WFV
|
Includes
data for November 12, 2013 (WFV3), November 15, 2014 (WFV3), November 2, 2015
(WFV1), November 5, 2016 (WFV2), September 13, 2017 (WFV3), November 22, 2018
(WFV4), November 13, 2019 (WFV2), and November 12, 2020 (WFV2), acquired from
China Center for Resources Satellite Data and Application with a resolution
of 16 m
|
3.2 Dataset
Development Process
The Landsat data are from the
Geospatial Data Cloud were geometrically corrected and geographically aligned.
The PIE remote sensing processing software developed by Aerospace Corp. was
used to synthesize the Landsat data into true color images by band, and then orthorectify
the GF1-WFV satellite data by combining with DEM. WFV data with Landsat data
served as the reference image for geometric correction, geographic alignment,
and other pre-processing. All remote sensing images are projected and converted
to a CGCS2000 coordinate system in ArcGIS software, and then the remote sensing
interpretation and extraction of the lake boundaries, vector editing, area
calculation and mapping are carried out. The extraction of the lake boundary is
undertaken by visual interpretation by professional technicians in ArcGIS
software, and the results are cross-checked and corrected to render the
2 http://www.cresda.com.
lake boundary
results as accurate as possible, calculate the lake water area in different
years, and establish the lake water spatial database.
4 Data Results
|
Table 3 Area dynamics of Taro Co Lake
(1975‒2020)
|
|
Year
|
Area (km2)
|
Year
|
Area (km2)
|
|
1975
|
482.37
|
2008
|
487.91
|
|
1977
|
482.38
|
2009
|
486.86
|
|
1988
|
482.00
|
2010
|
483.09
|
|
1990
|
480.93
|
2011
|
485.07
|
|
1996
|
470.11
|
2012
|
483.72
|
|
2000
|
477.90
|
2013
|
485.28
|
|
2001
|
480.72
|
2014
|
484.66
|
|
2002
|
479.68
|
2015
|
482.21
|
|
2003
|
479.45
|
2016
|
482.67
|
|
2004
|
479.99
|
2017
|
485.22
|
|
2005
|
480.18
|
2018
|
489.86
|
|
2006
|
482.15
|
2019
|
492.41
|
|
2007
|
483.22
|
2020
|
493.51
|
4.1 Dataset Composition
The
time series dataset (1975-2020) of
the lake area of Taro Co in Tibet includes vector data (.shp) during theof 26
years: 1975, 1977, 1988, 1990, 1996 and each year between2000-2020. The data
consist of a surface element and contain the lake water field (area in km2)
in addition to the necessary fields (Table 3).
4.2 Data Results
The
water area of Taro Co from 1975‒2020 experienced a process of first decreasing
and then increasing (Figure 1) i.e., between 1975‒1996 the water area decreased
from 482.37 km2 to 470.11 km2 and then began to gradually
increase, reaching 493.51 km2 in 2020. Fitting an ordinary least
squares (OLS) trend line to these data shows an average annual increase of 0.54
km2 (P < 0.005). significance test (= 3.135).
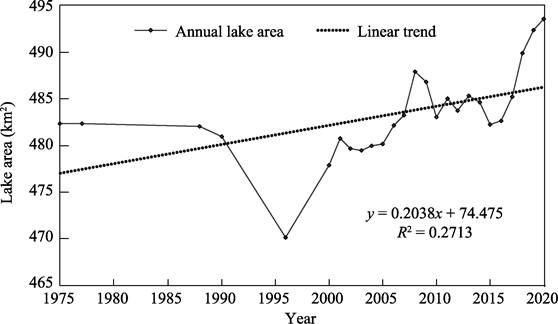
Figure
1 Area dynamics of
Taro Co Lake (1975‒2020)
Spatial changes
in the water boundary of Taro Co Lake are shown in Figure 2. It can be
discerned that, before 2010, boundary expansion mainly occurs in the eastern
region of the lake; after 2010, boundary expansion mainly occurs in the
southwestern region of the lake.
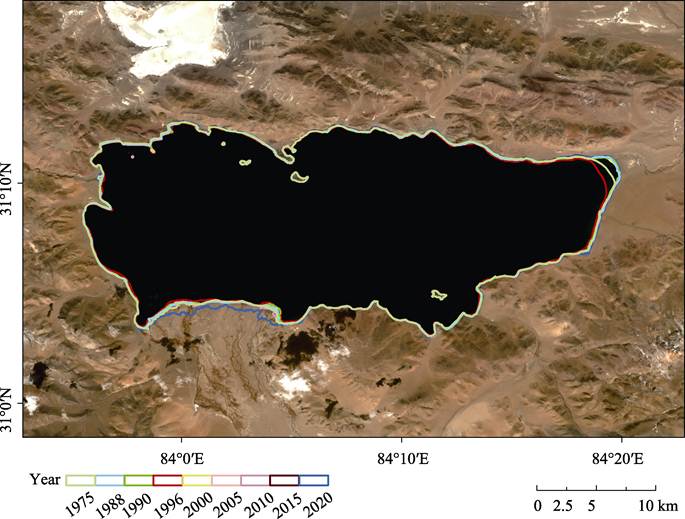
Figure
2 Map of spatial
variation of the watershed boundary of Taro Co Lake (1975‒2020)
5 Discussion and Conclusion
As an important
source of surface water, lakes are significantly affected by climate change and
are sensitive to climate fluctuations, which is of great scientific
significance in the context of revealing the response mechanisms of land
surface water cycles to climate change. From the data results, the watershed
area of Taro Co Lake experienced a process of first decreasing and then
increasing during the period from 1975 to 2020; watershed expansion is mainly
distributed in the eastern and southwestern regions of the lake.
This dataset constructs a longer time series vector
dataset of the area and spatial changes of Taro Co Lake compared to what was
previously available. As such, the data can be leveraged in future research
concerning the biophysical, ecological, and environmental responses of Taro Co
Lake to climate change.
Author Contributions
Niu, X. J. designed the
study; Li, L. collected the Landsat (MSS, TM, ETM) and GF1 (WFV) data; Niu, X. J. and Zeng,
L. processed, interpreted and analyzed the data; Zeng, L. wrote the manuscript.
All authors reviewed and approved the final submission.
Conflicts of Interest
The authors
declare no conflicts of interest.
References
[1]
Xu,
B., Cao, J., James, H., et al. Black soot and the survival of Tibetan glaciers [J]. Proceedings of the National Academy of
Sciences, 2009, 106(52): 22114-22118.
[2]
Chen,
D., Xu, B., Yao, T., et al. Assessment of past, present and future environmental changes on the
Tibetan Plateau [J]. Chinese Science
Bulletin, 2015, 60: 3025?C3035.
[3]
Pan, B., Li, J. Qinghai-Tibetan
Plateau: a driver and amplifier of the global climatic change-??. The
effects of the up lift of Qinghai-Tibetan Plateau on climatic changes [J]. Journal
of Lanzhou University (Natural
Sciences), 1996, 32(1): 108-115.
[4]
Qiao, B., Zhu, L., Yang, R.
Temporal-spatial differences in lake water storage changes and their links to
climate change throughout the Tibetan Plateau [J]. Remote Sensing of Environment, 2019, 222: 232-243.
[5]
Liu,
J., Wang, S., Yu, S., et al. Climate warming and growth of high-elevation inland lakes on the
Tibetan Plateau [J]. Global and Planetary
Change, 2009, 67: 209-217.
[6]
Zhang,
G., Yao, T., Chen, W., et al. Regional differences of lake evolution across China during
1960s?C2015 and its natural and anthropogenic causes [J]. Remote Sensing of Environment, 2017, 221: 386-404.
[7]
Ma,
R., Yang, G., Duan, H., et al. China??s lakes at present: number, area and spatial distribution [J].
Science China Earth Sciences, 2011,
54(2): 283-289.
[8]
Jiang,
L., Karina, N., Ole, B., et al. A bigger picture of how the Tibetan lakes change over the past
decade revealed by CryoSat-2 altimetry [J]. Journal
of Geophysical Research: Atmospheres,
2020, 125(23): e2020JD033161.
[9]
Zhang,
G., Yao, T., Xie, H., et al. Response of Tibetan Plateau??s lakes to climate changes: trend, pattern,
and mechanisms [J]. Earth-Science Reviews,
2020, 208: 103269.
[10]
Yao, X., Liu, S., Li, L., et al. Spatial-temporal variations of
lake area in Hoh Xil region in the past 40 years [J]. Acta Geographica
Sinica, 2013, 68(7): 886?C696.
[11]
Guo,
Y., Zhu, L., Frenzel, P., et al. Holocene lake level fluctuations and environmental changes at Taro
Co, southwestern Tibet, based on ostracod-inferred water depth reconstruction
[J]. The Holocene, 2016, 26(1): 29-43.
[12]
Wang, S., Dou, H. Lakes
in China [M]. Beijing: Science Press, 1998: 402.
[13]
Zheng,
M., Xiang, J., Wei, X., et al. Saline Lakes on the Qinghai-Xizang (Tibet) Plateau [M].
Beijing: Beijing Scientific and Technical Publishing House, 1989: 9-10.
[14]
Ma,
Q., Zhu, L., Lu, X., et al. Pollen-inferred Holocene vegetation and climate histories in Taro
Co, southwestern Tibetan Plateau [J]. Chinese
Science Bulletin, 2014, 59(31): 4101-4114.
[15]
Zeng,
L., Niu, X., Li, L. Taro Co changes dataset (1975?C2020) [J/DB/OL]. Digital Journal of Global Change Data Repository, 2021. https://doi.org/10.3974/geodb.2021.01.09.V1.
[16]
GCdataPR Editorial Office.
GCdataPR Data Sharing Policy [OL]. https://doi.org/10.3974/dp.policy.2014.05 (Updated
2017).