Daily, Monthly and Yearly Global Frictional Torque and Length of Day Dataset (1948-2015)
Gong, H. Huang, M.*
Institute of Geographic Sciences and Natural Resources Research, Chinese Academy of Sciences, Beijing 100101, China
Abstract: Changes in the earth’s rotational speed can be characterized by the length of day (LOD). Frictional torque is the axial moment of earth produced by atmospheric friction. The daily, monthly and yearly global frictional torque and length of day dataset (1948–2015) was developed based on LOD data and momentum flux data, which were integrated with the calculation method of Weickmann and Sardeshmukh (1994). The spatial resolution of the dataset was a T62 Gaussian grid with 192×94 pixels, and the data were averaged by day, month and year from 1948 to 2015. The dataset is archived in .xlsx format with a data size of 860 KB. An analysis paper based on the dataset was published in Progress in Geophysics in 2016 (Vol. 31, No. 4).
Keywords: frictional torque; length of day; globe; Progress in Geophysics
1 Introduction
The frictional torque is the axial torque of earth generated by the movement of the atmosphere relative to the solid earth. Frictional torque is one of the ways that angular momentum is transported between the solid earth and the atmosphere. Frictional torque is always affecting the movement of the solid earth and the atmosphere. As early as the 1950s, meteorologists used torque to discuss the relationship between atmospheric angular momentum and the earth’s rotation[1–2]. Weickmann and Sardeshmukh calculated the detailed frictional torque[3] and presented a standard calculation formula. The results from many studies indicate that frictional torque can explain the long-term changes in atmospheric angular momentum[4–6]. Weickmann and Sardeshmukh found that an increase in atmospheric angular momentum is associated with a positive frictional torque[3]. Madden and Speth calculated the frictional torque and atmospheric angular momentum for 13 months between 1987 and 1988 based on data from the European Centre for Medium-Range Weather Forecasts[5]. They found that the frictional torque is highly correlated with the 50-day oscillation of the atmospheric angular momentum. Frictional torque is also known to affect the local weather and atmospheric circulation system[7–8].
The solid-earth angular momentum should be studied when considering the total angular momentum. Therefore, length of day (LOD) is used to describe the solid-earth angular momentum and changes in rotational speed in this paper. In previous investigations, LOD was shown to be highly correlated with atmospheric angular momentum[9–10]. On short timescales, LOD and atmospheric angular momentum are approximately linearly related[11]. However, the mechanism and interaction process are not clear. To solve this problem, we created a dataset of daily, monthly and yearly frictional torque and LOD.
2 Metadata of Dataset
Metadata summary of the global frictional torque and length of day dataset in daily-monthly-yearly timescale (1948-2015)[12] is listed at Table 1.
Table 1 Metadata summary of global frictional torque and length of day dataset in daily-monthly-yearly timescale (1948-2015)
|
Items
|
Description
|
|
Dataset full name
|
Global frictional torque and length of day dataset in daily-monthly-yearly timescale (1948-2015)
|
|
Dataset short name
|
GlobalFrictionalTorqueLengthDay_1948-2015
|
|
Authors
|
Gong, H. F-8138-2015, Institute of Geographic Sciences and Natural Resources Research, Chinese Academy of Sciences, hh_1@sina.com
Huang, M. W-6639-2018, Institute of Geographic Sciences and Natural Resources Research, Chinese Academy of Sciences, huangm@igsnrr.ac.cn
|
|
Geographical region
|
Globe Year 1948-2015
|
|
Data format
|
.xlsx
|
|
|
|
Data size
|
860 KB
|
|
|
|
Data files
|
The dataset consists of four tables in one Excel file:
Table 1: Daily average values of global frictional torque and LOD from 1948 to 2015. The data sheet includes 24,873 daily average global frictional torque data records from 1948 to 2015 and 18,623 daily average LOD records from 1962 to 2012
Table 2: Yearly average values of global frictional torque and LOD from 1948 to 2015. The data sheet includes 68 data records of global frictional torque from 1948 to 2015 and 66 records of LOD from 1948 to 2013
Table 3: Monthly average values of global frictional torque and LOD from 1962 to 2010. There are 588 data records for each variable
Table 4: Multi-year average values of monthly global frictional torque and LOD from 1962 to 2010
|
|
Foundations
|
Ministry of Science and Technology of P. R. China (2012CB957802); National Natural Science Foundation of China (41671101)
|
|
Data publisher
|
Global Change Research Data Publishing & Repository, http://www.geodoi.ac.cn
|
|
Address
|
No. 11A, Datun Road, Chaoyang District, Beijing 100101, China
|
|
Data sharing policy
|
Data from the Global Change Research Data Publishing & Repository include metadata, datasets (data products) and publications (in this case, in the Journal of Global Change Data & Discovery). Data sharing is guided by the following policy: (1) Data are openly available and can be freely downloaded via the Internet; (2) end users are encouraged to use the Data subject to citation; (3) users, who are by definition also value-added service providers, are welcome to redistribute the Data subject to written permission from the GCdataPR Editorial Office and the issuance of a Data redistribution license; and (4) if Data are used to compile new datasets, the ‘ten per cent principal’ should be followed such that the Data records utilized should not surpass 10% of the new dataset contents, and sources should be clearly noted in suitable places in the new dataset[13]
|
3 Methods
3.1 Equations and Data
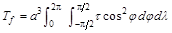
In this paper, we used NCEP/NCAR Reanalysis 1 data[14] to calculate the frictional torque Tf using the following equation[3]:
 (1)
(1)
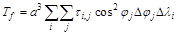
where a is the radius of earth (6,371 km), τ is the surface frictional stress (N/m2), λ is the longitude (o) and φ is the latitude (o). The Reanalysis 1 data had a temporal resolution of 6 hours and spatial resolution of 192×94 Gauss points from 1948 to 2015. For the NCEP/NCAR grid data, Equation (1) can be approximated as
 (2)
(2)
where a is the radius of earth, τi,j is the surface frictional stress value at point (i, j), Δλi is the width or a “longitude strip” which is dependent on the spacing in the grid,Δφj is the same with Δλi but latitude. The unit of global frictional torque in this dataset is Hadleys (1 Hadley = 1.0×10¹⁸ kg·m2/s2).
The LOD can reflect changes in the earth’s rotational speed. LOD can be calculated as the difference between Universal Time (UT1) and Coordinated Universal Time (UTC) (ms).
LOD = UT1 – UTC (3)
Very-long-baseline interferometry can be used to observe the rotation of the earth. This method has greatly improved the accuracy of LOD, and the accuracy can now reach 0.01 ms[14].
|
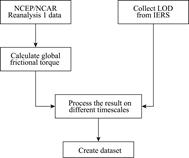
Figure 1 Procedure of the dataset
development
|
3.2 Data Collection and Processing
We calculated global frictional torque using NCEP/NCAR Reanalysis 1 data[15] and obtained LOD data from the International Earth Rotation and Reference Systems Service (IERS)[16]. The process of constructing the dataset is shown in Figure 1.
4 Results and Validation
4.1 Dataset Composition
The constructed dataset contains daily and annual average data of frictional torque from 1948 to 2015; annual average LOD data from 1948 to 2015; daily average LOD data from 1962 to 2010; monthly average frictional torque and LOD data from 1962 to 2010; and 12 monthly data of frictional torque and LOD by the average from 1962 to 2010.
4.2 Data Results
The frictional torque and LOD showed decreasing trends from 1948 to 2015 (Figure 2) [12,17]. In the study period, the highest frictional torque of approximately 9.04 Hadley occurred in 1954, and the lowest value of approximately 11.64 Hadley appeared in 1993. The decreasing trend in frictional torque was the most obvious before 1998; the decreasing trend became weak after 1998, and frictional torque increased after 2000. During the study period, the average annual decrease in frictional torque was 0.18 Hadley.
Before the 1970s, the value of frictional torque was positive, and the solid earth transmitted angular momentum to the atmosphere via the frictional torque. As the solid earth lost axial angular momentum, the earth’s rotation speed decreased, and LOD increased. This change can also be seen in the LOD time series. As the atmosphere gains angular momentum, the atmospheric motion and circulation will be strengthened, leading to extreme weather events and global climate change.
After the 1970s, most values of frictional torque were negative. During this period, the atmosphere transmitted angular momentum to the solid earth through frictional torque. As a result, the motion of the atmosphere slowed while the rotation speed of the solid earth increased, causing the LOD to decrease. This change is clearly seen in the LOD time series. The decrease in LOD is not only reflected in the speed of earth’s rotation. In terms of climate, the precipitation distribution in China changed significantly around the 1970s. The East Asian monsoon also mutated around this time.
|
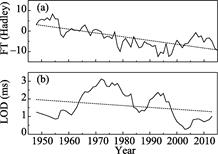
Figure 2 Annual mean values of frictional torque and LOD from 1948 to 2015[12,17]
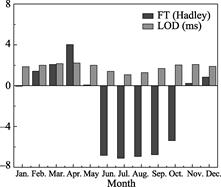
Figure 3 Average monthly values of frictional torque and LOD from 1962 to 2010[12,17]
|
The maximum LOD of 3.13 ms was observed in 1972, and the minimum value of 0.27 ms appeared in 2003[12]. Before the 1970s, LOD exhibited an increasing trend, which switched to a decreasing trend after the 1970s[17]. During the study period, the average decrease in LOD was calculated by linear fitting to be 0.01 ms/a. On a long timescale, LOD is closely related to the frictional torque. The annual average curves of LOD and frictional torque can partially reflect the interaction between the solid earth and the atmosphere. Thus, these variables are important for studying global climate change.
As shown in Figure 3, the values of frictional torque and LOD are the lowest in July[12,17] and the highest in April. From June to October and in January, the frictional torque is negative. In other months, the frictional torque is positive. The value of frictional torque can partially reflect the change in LOD. Existing research indicates that on short timescales (less than a year), changes in the motion of the solid earth are primarily caused by the atmosphere, and the atmospheric angular momentum is linearly related to LOD. As part of the atmospheric angular momentum, the frictional torque cannot fully reflect the change in LOD. The influences of mountain torque and gravity wave torque cannot be ignored.
5 Discussion and Conclusion
This dataset is based on NCEP/NCAR Reanalysis 1 and data on the earth’s orientation from IERS. We calculated the frictional torque and LOD at different timescales (daily, monthly and annually), resulting in a dataset with a temporal resolution of 1 day from 1948 to 2015. The dataset can reflect the changes in frictional torque and LOD from 1948 to 2015. This dataset has been applied to study the relationship between torque and LOD on different timescales. The dataset is useful for studying the transfer of angular momentum between the atmosphere and the solid earth. The results indicate that both frictional torque and LOD generally decreased over the study period. Around the 1970s, frictional torque changed from positive to negative, and LOD reached its maximum value. The frictional torque and LOD show similar trends and fitted curves. Both frictional torque and LOD are low in the summer and autumn and high in the winter and spring. In addition, both are minimized in July and maximized in March. The changes in frictional torque and LOD reflect the status of the transmission of angular momentum and are important for understanding global climate change.
This dataset can be used in earth science studies. The frictional torque data in the dataset are the globally integrated results. The spatial Gaussian grid data (192×94 grid points) are not included; these data will be provided in a future study. The relationship between frictional torque and LOD in special areas and at different latitudes/longitudes will also be discussed in future work.
Author Contributions
Huang, M. designed the algorithms for the dataset. Gong, H. contributed to data processing and analysis and wrote the paper.
References
[1] Rosen, R. D., Salstein, D. A. Contribution of stratospheric winds to annual and semiannual fluctuations in atmospheric angular momentum and the length of day [J]. Journal of Geophysical Research Atmospheres, 1985, 90(D5): 8033-8041.
[2] Zheng, D., Ding, X., Zhou, Y., et al. Earth rotation and ENSO events: combined excitation of interannual LOD variations by multiscale atmospheric oscillations [J]. Global & Planetary Change, 2003, 36(1): 89-97.
[3] Weickmann, K. M., Sardeshmukh, P. D. The atmospheric angular momentum cycle associated with a Madden-Julian oscillation [J]. Journal of the Atmospheric Sciences, 1994, 51(21): 3194-3208.
[4] Oort, A. H. Angular momentum cycle in the Atmosphere-Ocean-Solid Earth System [J]. Bulletin of the American Meteorological Society, 1989, 70(10): 1231-1342.
[5] Madden, R. A., Speth, P. Estimates of atmospheric angular momentum, friction, and mountain torques during 1987–1988 [J]. Journal of the Atmospheric Sciences, 1995, 52(21): 3681-3694.
[6] Egger, J., Weickmann, K., Hoinka, K. P. Angular momentum in the global atmospheric circulation [J]. Reviews of Geophysics, 2007, 45(4): RG4007. DOI: 10.1029/2006rg000213.
[7] Rosen, R. D. The axial momentum balance of Earth and its fluid envelope [J]. Surveys in Geophysics, 1993, 14(1): 1-29.
[8] Shi, W. J., Yang, P., Xiao, Z. N. Progress in studies on the atmospheric angular momentum [J]. Advances in Meteorological Science and Technology, 2014, 4(3): 13-19.
[9] Gu, Z. N. Imbalance of seasonal budget in the atmospheric angular momentum and length of day [J]. Annals of Shanghai Observatory Academia Sinica, 1996, 17: 73-79.
[10] Yang, P., Shi, W., Xiao, Z., et al. Spatial and temporal variations of atmospheric angular momentum and its relation to the earth length of day [J]. Acta Meteorologica Sinica, 2014, 28(1): 150-161.
[11] Langley, R. B., King, R. W., Shapiro., I. I., et al. Atmospheric angular momentum and the length of day: a common fluctuation with a period near 50 days [J]. Nature, 1981, 294(5843): 730-732.
[12] Gong, H., Huang, M. Global frictional torque and length of day dataset in daily-monthly-yearly timescale (1948-2015) [DB/OL]. Global Change Research Data Publishing & Repository, 2018. DOI: 10.3974/
geodb.2018.05.15.V1.
[13] GCdataPR Editorial Office. GCdataPR data sharing policy [OL]. DOI: 10.3974/dp.policy.2014.05 (Updated 2017).
[14] Xu, J. Y. Research on the theories and algorithms of earth orientation parameters prediction [D]. Zhengzhou: PLA Information Engineering University, 2010.
[15] ESRL. Physical Sciences Division, NCEP/NCAR Reanalysis 1 [OL]. https://www.esrl.noaa.gov/psd/data/ gridded/data.ncep.
[16] Reanalysis.html#plot International Earth Rotation and Reference Systems Service, IERS [OL]. https://www.iers. org /IERS/EN/Home/home_node.html.
[17] Gong, H., Huang, M., Zhu, L., et al. Relationships between global frictional torque and length of day in three time scale [J]. Progress in Geophysics, 2016, 31(4): 1438-1443. DOI: 10.6038/pg20160404.