Geographic Information Dataset of Urban Housing
Price Changes in the Yangtze River Delta Region (2008?C2018)
Ma, Y. Z.1,2
Li, X. L.1,2 Song,
W. X.1,3*
1. Nanjing Institute of Geography and Limnology, Chinese
Academy of Sciences Nanjing 210008, China;
2. University of Chinese Academy of Sciences, Beijing
101408, Beijing, China;
3. Nanjing Institute of Geography and Limnology, Key Laboratory
of Watershed Geographic Sciences, Chinese Academy of Sciences, Nanjing 210008,
Jiangsu, China
Abstract: To study the factors influencing urban
housing price changes in the Yangtze River Delta region, the authors used the
national real estate transaction information platforms, such as Fangtianxia
(www.fang.com) and 365 Taofang.com (www.house365.com), to search for data relevant
to this research objective. Through data collection and analysis, house prices
in 327 districts or counties in 41 cities in the Yangtze River Delta from 2008
to 2018 were itemized and reorganized, namely as the Geographic Information Data Set of Urban Housing Price Changes in the
Yangtze River Delta Region (2008?C2018). This data set includes: (1) city
and county boundary data in the region; (2) house prices in 41 cities and 327
districts or counties in the region from 2008 to 2018. The data show that house
price is the monetized expression of the abundance of resources such as urban
economy, human, society, and administration. The regional house price
differentiation is a comprehensive indicator of differences in the ability of
urban dominating resources. It is difficult for housing prices in the districts
or counties of the Yangtze River Delta to achieve "club convergence"
in a short period of time, so the gap in housing prices between core cities
(e.g., Shanghai, Nanjing, Hangzhou) and other cities may continue to expand.
The data set is stored in .xls and .shp formats and consists of three data
files with a total volume of 14 MB (compressed to 1 file, 4.37MB). The research
results based on this data set have been published in Geography Research, 2018,
volume 37, issue 1.
Keywords: data of counties and districts;
data of cities; housing price; Yangtze River Delta Region
1 Introduction
Since the implementation of
the urban housing system reform in 1998, urban housing prices in China have
been increasing steadily. The problem of high housing prices has attracted broader
attention. Especially so for the megacities, where the excessive growth rate
causes the housing price risk to rise, and real estate bubbles become common.
House prices depend on the level of development of a
region or country, including its economic, social, political dimensions and so
on, which together affect the development and stability of a given region (or
country). In the process of rapid social development and urban renewal, housing
prices can vary greatly according to differences in the various resource
allocation capabilities among cities, and these price gaps are currently
widening. Usually, the index system of such influencing factors of housing
price differentiation is based on supply?Cdemand theory [1?C2] and
urban hedonic price theory [3?C4]. The first theory explores the
influencing factors of urban housing price differentiation from the perspective
of equilibrium prices of housing supply and the second the demand and location equilibrium
between manufacturer and consumer [5?C6]. Currently, scholars at home
and abroad have focused on the specific factors that stem from aspects of the
economy, society, manpower, and administration and that affect such price
differentiations. They mainly include urban location and administrative level,
population structure, wealth level of residents, mileage of traffic, immigration
population scale, direct foreign investment, urban center, public services
within cities, and traffic conditions, among others. [8-13]
Housing prices in the Yangtze River Delta region are
one of the highest in the country, and they are increasing rapidly. The
regional housing price difference is significant, in terms of its high research
value. As an example of an integrated area, the Yangtze River Delta region has
the advantages of a developed economy: population concentration, strong public
service ability, and convenient transportation. It also benefits from close
inter-city links, frequent factor mobility, and fewer obstacles. Although the
level of integration among cities in the Yangtze River Delta region is high,
the type of cities are various. This data set thus explores the spatial pattern
and housing price differences in the Yangtze River Delta region, which can provide
a new perspective on housing price differentiation in this region, one that may
contribute to adjustments in housing development policy.
2 Metadata of the Dataset
The name, author,
geographical region, data time, time resolution, data set composition, data
publishing and service platform, data sharing policy, and other relevant
information of the dataset[14] are shown in Table 1.
Table 1 Metadata
summary of Geographic Information Data
Set of Urban Housing Price Changes in Yangtze River Delta Region (2008?C2018)
|
Items
|
Description
|
|
Dataset full name
|
Geographic
Information Dataset of Urban Housing Price Changes in Yangtze River Delta Region
(2008?C2018)
|
|
Dataset short
Name
|
HousingPriceYangtzeRD_2008?C2018
|
|
Authors
|
Ma Yuzhu, Z-2985-2019, Nanjing Institute of Geography and Limnology??mayuzhu17@mails.ucas.ac.cn
|
|
Li Xiaoli, Z-2992-2019, Nanjing Institute of Geography and Limnology??lixiaoli17@mails.ucas.ac.cn
|
|
Song Weixuan??N-1173-2018??Nanjing
Institute of Geography and Limnology??wxsong@niglas.ac.cn
|
|
Geographical
region
|
The Yangtze River
Delta Region (30??43'20"N?C33??5'16"N;
119??15'36"E?C120??29'0"E)
|
|
Year
|
2008?C2018
|
Time resolution 1 year
|
|
|
Data format
|
.shp and .xls
|
Data size
4.37 MB (after compression)
|
(To be continued on the next page)
|
Items
|
Description
|
|
Data files
|
1. City and county boundary data in the Yangtze River Delta region; 2.
Housing price data of 41 cities and 327 districts or counties in the Yangtze
River Delta region from 2008 to 2018 (Including revoked zones and functional
zones).
|
|
Foundation
|
National Natural Science Foundation Project (41771184)
|
|
Data publisher
|
Global Change Research Data Publishing & Repository,
http://www.geodoi.ac.cn
|
|
Address
|
No. 11 Datun Road, Chaoyang District, Beijing 100101, China
|
|
Data sharing policy
|
The "data" of Global Change Research Data Publishing &
Repository includes metadata (Chinese and English), entity data (Chinese and
English), and data papers published through the Journal
of Global Change Data & Discovery (Chinese and English). Its
sharing policy is as follows: (1) Data are freely available to the whole
society through the Internet system in the most convenient way, and users can
browse and download it for free; (2) Users need to label data sources in
reference documents or other appropriate places according to the citation format;
(3) Users of value-added services or other who disseminate "data"
in any form (including through computer servers) need to sign a written
agreement with the editorial department of the Journal of Global Change Data & Discovery (Chinese and English)
to obtain permission; (4) Authors who extract some records from
"data" to create new data need to follow the 10% citation
principle, which means that the extracted data records are less than 10% of
the total records of the new data set, and the extracted data records need to
be labeled with data sources [15]
|
|
Communication and searchable system
|
DOI, DCI, CSCD, WDS/ISC, GEOSS, China GEOSS
|
3 Data Sources
and Research Areas
3.1 Data Sources
The vector data of
administrative boundary came from the diva-gis website (www.diva-gis. org). Individual
obsolete boundary data have been readjusted according to the latest administrative
divisions, which are inquired in the websites of municipalities. Housing price
data came from national real estate trading information platforms, such as
Fangtianxia (www.fang.com) and 365 Taofang (www.house 365.com). The data in
these websites were collected by professional information collectors, or
provided by developers and intermediaries. After that, the collected data were
reorganized, filtered, with duplicates and outlier data eliminated, so as to compile timely and comprehensive
housing price data set. The China Index Academy also uses the data from
Fangtianxia as original data (details can be seen on the official website: industry.fang.com),
so we presumed the data have good reliability. It should be pointed out 10
revoked or important functional areas have been eliminated from the data (in
Excel), leaving 317 districts and counties in the vector data.
3.2 Research Areas
This data set includes three
provinces and one province-level municipality
in the Yangtze River Delta: Shanghai, Jiangsu, Zhejiang, and Anhui, totaling 41
cities and 327 districts or counties. Because of the significant differences in
economic power, population, and traffic conditions among the cities, especially
between core cities such as Shanghai, Nanjing, Hangzhou and other cities, this
may cause spatial heterogeneity in overall housing prices[16]. There're
also certain gaps in the development level among downtown areas, suburbs, and
counties, so there may be obvious spatial differentiation of housing prices in a
city as well.
3.3 Data Development
Technology Route
Technical route: To study the
housing price differentiation patterns in the Yangtze River data, firstly, we
compared the mean value of housing prices in the data with those of the whole
co- untry in 2008?C2018 and plotted them, and then summarized the
characteristics of each stageof growth. Then we conducted a three-stage
analysis of the growth rate in housing prices to identify the agglomeration
characteristics. Finally, we visualized the data, trying to ascertain the
overall and local differentiation pattern of urban housing prices, and proposed
the future directions for follow-up research.
4 Data Composition and Results
4.1 Dataset Composition
|
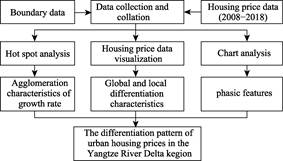
Figure 1 Technology Roadmap
|
Geographic Information Data
Set of Urban Housing Price Change in Yangtze River Delta Region (2008?C2018) includes
two parts: 1. The administrative boundary of the Yangtze River Delta region,
for which the file format is .shp; 2. The housing price data of the cities and
counties in the Yangtze River Delta region, for which the file format is .xls.
4.2 Data Results
|
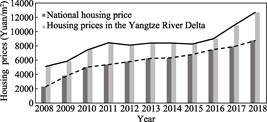
Figure
2 Periodic growth trends in housing
prices of the Yangtze River Delta region
|
The
overall growth trend for urban housing prices in the data set appears periodic
(Fig. 2), which is similar to China??s national pattern. There're three stages from 2008 to 2018. The first stage
lasted from 2008 to 2011, when housing prices rose rapidly; the second stage was
from 2011 to 2015, when housing prices remained stable; the third was from 2015
to 2018, marked by housing prices re-entering a period of faster growth.
For these three stages, an analysis of housing price growth rates is
shown in Fig. 3.This revealed that the high-value growth rate was concentrated
in Zhejiang, especially near Wenzhou, in the first-stage; the second-stage high
value was concentrated in the Anhui and northern Jiangsu; that for the
third-stage was around core cities, such as Shanghai, Nanjing, Hangzhou and Hefei.
Based on the data of 327 districts or counties in 2008?C2018, housing
prices in the Yangtze River Delta generally showed a steady upward trend.
Notably, growth for 2012?C2015 was relatively stable, when house prices rose by
an average of just 1.36%. By contrast, in 2008?C2011 and 2016?C2018, housing
prices rose rapidly, with average increases of 18.49% and 16.21%, respectively.
As Fig. 4 shows, high housing prices mainly occurred in the central urban areas
of Shanghai, Nanjing and Hangzhou. The highest value was found in the Shanghai
Jing'an District in 2018, where the house price exceeded 90,000 yuan/m2,
and the maximum increase and the fastest growth rate occurred respectively in
the Shanghai Jing'an District and Hefei Binhu New District. In 2008, only 30 areas
had housing prices that exceeding 10,000 yuan/m2, which accounted
for only 9% of the total. By 2018, however, 163 areas attained housing prices
of more than 10,000 yuan/m2, accounting for half of the total.In
northern Jiangsu and Anhui (except for Hefei), the prices of most areas have
increased, but they have not yet surpassed the 10,000 yuan/m2; this
exemplifies the geographic difference between the north and south in housing
prices from the overall pattern of housing pric es in the data. The difference
in housing prices between the counties and districts in a given city of the
Yangtze River Delta was also significant, and this gap continues to widen. In
2008, the greatest gap was in Shanghai, where it exceeded 22,000 yuan/m2;
by 2018, this gap coming close to 80,000 yuan/m2. Over this period,
Chizhou, which had the smallest gap in 2008, also expanded from 904 yuan/m2
to 3,466 yuan/m2, reflecting the partial differentiation
pattern of urban housing prices in the Yangtze River Delta.
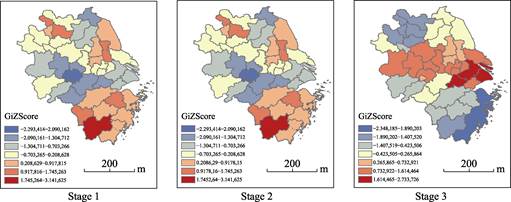
Figure 3 Three-stage hotspot analysis of housing
price growth rates in the Yangtze River Delta region
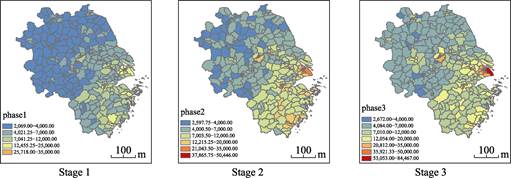
Figure 4 Distribution map of housing prices of
districts or counties in the Yangtze River Delta Region
5 Discussion
and Conclusion
Against
the background of rapid housing price growth, the greater risks, and the significant
differences, this data set aimed at providing new research materials and
perspectives for the spatial differentiation pattern, mechanisms, and effects
of housing prices in the Yangtze River Delta region. According to the data visualization
results, house prices in the region have risen steadily over 2008?C2018, showing
periodic characteristics and overall and local differences in the spatial distribution.
This study only combined house price data with vector data, and then developed
a simple spatial analysis and description. Hence, it didn't consider endogenous factors, such as economy,
society, administration and so on, and external factors, such as housing
policy, economic situation, and spillover effects[17?C18], to analyze
the data in depth. Therefore, this data set provides a readily accessible
database for future in-depth research on housing price trends. But the urban
endogenous and external factors that can jointly affect housing price
differentiation need to be further collected and collated. The next step should
focus on data on the impact mechanisms and spatial effects underpinning the differentiation
in housing prices that we revealed here. This enabled us to better explore the
reality and critical factors governing such differentiation in the region, to
understand housing prices in various cities, to provide a reference for the
government to implement differentiated housing development policies, and to
motivate commitment towards contributing to the healthy and stable operation of
the real estate market. At the same time, we could also explore the mutual
feedback mechanism(s) between housing price differentiation and the integration
process, to provide fresh ideas for high-quality integration from the
perspective of housing prices.
Author
Contributions
Ma, Y. Z.
analyzed data; Li, X. L. collated the housing price data and boundary data;
Song, W. X. was responsible for the overall design of the dataset and its
development and also collected housing price data. Ma, Y. Z. and Li, X. L.
wrote the data paper
References
[1]
Davidoff T. Labor income,
housing prices, and home ownership [J]. Journal
of Urban Economics, 2006, 59(2): 209-235.
[2]
Chen, J. H., Guo, F., Wu, Y.
One decade of urban housing reform in China: urban housing price dynamics and
the role of migration and urbanization, 1995-2005 [J]. Habitat International, 2011, 35(1): 1-8.
[3]
Gabriel, S. A., Mattey, J. P.,
Wascher, W. L. Compensating differentials and evolution of the quality-of-life
among U.S. states [J]. Regional Science
and Urban Economics, 2003, 33(5): 619-649.
[4]
Haurin, D. R., Brasington, D.
School quality and real house prices: inter- and intrametropolitan effects [J].
Journal of Housing Economics, 1996,
55(4): 351-368.
[5]
Roback, J. Wages, rents, and
the quality of life [J]. Journal of
Political Economy, 1982, 90(6): 1257-1278.
[6]
He, M., Ke, S. Z., Wen, Y.
Amenities and regional differentials of real estate prices in Chinese cities
[J]. The Theory and Practice of Finance
and Economics, 2009, 300(2): 97-103.
[7]
Song, W. X., Liu, C. H. The
price differentiation mechanism of commercial housing in the Yangtze River
Delta [J]. Geographical Research,
2018, 37(1): 92-102.
[8]
Wang, Y., Wang, D. L., Wang, S.
J. Spatial differentiation patterns and impact factors of housing prices of
China¢s cities [J]. Scientia Geographica Sinica, 2013, 33(10): 1157-1165.
[9]
Wang,
S. J., Wang, Y., Lin, X. Q, et al.
Spatial differentiation patterns and influencing mechanism of housing prices in
China: Based on data of 2872 counties [J].
Acta Geographica Sinica, 2016, 71(8): 1329-1342.
[10]
Liu, J. The research on
convergence and its factors of urban housing prices in Pearl River Delta city
clusters [D]. Guangzhou: South China University
of Technology, 2018.
[11]
Zhang, N. N. A study on the
factors of house prices in Beijing-Tianjin-Hebei Region [D]. Changchun: Jilin
University, 2017.
[12]
Wen, H. Z., Tao, Y. L.
Polycentric urban structure and housing price in the
transitional China: evidence from Hangzhou [J]. Habitat
International, 2015, 46: 138-146.
[13]
Zhang, S. Y., Song, X. Q., Den,
W. Impact of public services on housing prices in different functional spaces:
a case study of metropolitan Chengdu [J]. Progress
in Geography, 2017, 36(8): 995-1005.
[14]
Ma, Y. Z., Li, X. L., Song, W.
X. Geographic information dataset of urban housing price change in Yangtze
River Delta Region (2008-2018) [DB/OL]. Global Change Research Data Publishing
& Repository, 2019. DOI: 10.3974/geodb.2019.04.17.V1.
[15]
GCdataPR Editorial Office. GCdataPR data sharing
policy [OL]. DOI: 10.3974/dp.policy.2014.05 (Updated 2017).
[16]
Quigley, J. Consumer choice of
dwelling, neighborhood and public services [J]. Regional Science and Urban Economics, 1985, 15(1): 41-63.
[17]
Groves, J. R., Rogers, W. H.
Effectiveness of RCA institutions to limit local externalities: using
foreclosure data to test covenant effectiveness [J]. Land Economics, 2011, 87(4): 559-581.
[18]
Nanda, A., Ross, S. L. The impact of property condition
disclosure laws on housing prices: evidence from an event study using
propensity scores [J]. Journal of Real
Estate Finance and Economics, 2012, 45(1): 88-109.