Training Samples Dataset for Building
Identification in Urban
Village
Liu, Y. F.1,2 Lv, B. R.1,3 Peng, L.1* Wu, T.1,3 Liu, S.4
1. Aerospace Information Research Institute,
Chinese Academy of Sciences, Beijing 100101, China;
2. Ucastech (Beijing) Smart Co. Ltd., Beijing
100080, China;
3. University of Chinese Academy of Sciences, Beijing 100049, China;
4. Beijing Qingruanhaixin Technology Co. Ltd.,
Beijing 100085, China
Abstract: Identifying buildings from remote sensing imagery is an important
basic methodology used in urban management. The distribution pattern of the
building clusters, especially the high density of buildings and narrow streets,
among others, are more critical for urban managers. Based on the remotely
sensed images obtained in Google Maps, 2328 samples of building clusters in an
urban village were drawn by using LabelMe software. The building information
was extracted by using the Mask R-CNN, which is an example of a segmentation
algorithm used in deep learning. The dataset includes: (1) original sample
images (Buildingsample_pic); (2) sample segmentation results (Buildingsample_mask),
and; (3) sample segmentation annotation (Buildingsample_info). The datasetconsists
of 6,984 data files in three data folders, having .png and .yaml data formats.
The data size is 499 MB (compressed into one file: 498 MB). The research paper
related to the datasetbe published in the Proceedings of the first China
Digital Earth Conference.
Keywords: urban village; building cluster; deep
learning; Mask R-CNN;
Proceedings of the first China Digital Earth Conference
Dataset Avialable Statement:
1 Introduction
With the continuous
development of urban construction and urban governance, the problem of the
urban village is now of widespread concern[1-2]. The urban
village is a residential area built on the original rural collective??s land and
farmers?? homestead during phases of urban expansion,
in which buildings are an important part. Urban village buildings are disordered
and heterogeneous settlement patterns perhaps best described as ??city is not
like city, village is not like village??[3]: because of its high
density of buildings, narrow streets and lanes, illegal building and other
characteristics, the urban villages?? shape is diverse and is structurally complex,
which has always been a contentious topic in
academic research. The urban village building community is a target subject,
with discernable structural characteristics, in the analysis of remotely sensed
images of urban areas. Due to its unique distribution and pattern of urban
village building community, it is of great significance to extract buildings
based on deep learning. In recent years, with advances in artificial
intelligence and deep learning techniques, many scholars have begun to research
how to apply deep learning to extract buildings from such imagery. Compared
with a data-driven and model-driven method, the building extraction process
based on machine learning requires less prior knowledge and can achieve high
extraction accuracy when using suitable samples[4-7]. In this paper,
a large and medium-sized city in northern China was selected as the sample
drawing basis. By using Google Maps imagery, with a spatial resolution of 0.11
m, a total of 2,328 urban village building samples were drawn by LabelMe
software. This study provides basic data for remote sensing image analysis
based on deep learning, specifically the case segmentation algorithm mask R-CNN,
and includes an application case of the case segmentation sample. This work has
practical significance for applying artificial intelligence information extraction
in urban governance.
2 Metadata of the Dataset
The
metadata of the ??Training Samples Dataset for Building Identification in the
Urban Village?? is summarized in Table 1. It includes the dataset full name,
short name, authors, year of the dataset, temporal resolution, spatial
resolution, data format, data size, data files, data publisher, and data
sharing policy, etc.
Table 1 The metadata summary of the dataset
|
Item
|
Description
|
|
Dataset full name
|
Training samples dataset for building identification in the urban village
|
|
Dataset short name
|
Samples_BuiUrbanVill
|
|
Authors
|
Liu, Y. F, Aerospace Information Research Institute, Chinese
Academy of Sciences, Ucastech
(Beijing) Smart Co. Ltd., 18811519832@163.com
Lv, B. R., Aerospace Information Research
Institute, Chinese Academy of Sciences, University of Chinese Academy of
Sciences, 1121222861@qq.com
Peng, L., Aerospace Information Research
Institute, Chinese Academy of Sciences, pengling@aircas.ac,cn
Wu, T., Aerospace Information Research
Institute, Chinese Academy of Sciences, University of Chinese Academy of
Sciences, tongw_indus@126.com
Liu, S., Beijing Qingruanhaixin Technology
Co. Ltd., liusai@hesion3d.com
|
|
Year
|
2018?C2019 Spatial
resolution 0.11 m
|
|
Data format
|
.png, .txt, .yaml Data
size 498 MB (after
compression)
|
|
Dataset files
|
Original sample images; Sample segmentation result; sample segmentation
annotation
|
|
Foundation
|
The Beijing Municipal Science and Technology Project (Z191100001419002)
|
|
Data Computing
Environment
|
GPU: NVIDIA GP102 [TITAN Xp];
Python: 3.6; TensorFlow-gpu: 1.3.0; Keras: 2.0.8
|
|
Data Publisher
|
Global Change Research Data Publishing & Repository
http://www.geodoi.ac.cn
|
|
Address
|
No.
11A, Datun Road, Chaoyang District, Beijing 100101, China
|
|
Data sharing policy
|
Data from
the Global Change Research Data Publishing & Repository includes metadata, datasets (in the Digital Journal of Global Change Data Repository), and publications
(in the Journal of Global Change Data & Discovery). Data sharing policy includes: (1) Data
are openly available and can be free downloaded via the Internet; (2) End
users are encouraged to use Data subject to citation; (3)
Users, who are by definition also value-added service providers, are welcome
to redistribute Data subject to written permission from the GCdataPR
Editorial Office and the issuance of a Data redistribution license; and (4)
If Data
are used to compile new datasets, the ??ten per cent principal?? should be followed
such that Data records utilized should not surpass 10% of the new
dataset contents, while sources should be clearly noted in suitable places in
the new dataset[9]
|
|
Communication and
searchable system
|
DOI, DCI, CSCD, WDS/ISC, GEOSS, China GEOSS, Crossref
|
3 Data Development Methods
The sample of remotely
sensed images were divided into target detection samples, semantic segmentation
samples, and instance segmentation samples according to their specific uses[6]. The samples used for target
detection must have the location and type of the target feature labeled, i.e.,
by drawing the external rectangular box of the target feature and labeling its
category; for semantic segmentation, its sample needs to have the outline and
type of the target feature labeled, i.e., by drawing the outline of the target
feature and labeling its category; for instance segmentation, its sample should
have the outline and the category of the target feature marked, that is, by
drawing the outline of a single object and labeling its category. Currently,
the most commonly used software tools for drawing on images are LabelMe,
ArcGIS, and LabelImg.
According to the remote sensing imagery and from the ground real-scene
photos, this paper used LabelMe software to obtain the building instance
segmentation samples from an urban villages, which were later used for deep
learning by the instance segmentation
algorithm.
(1) Imagery selection
Combined with the unique distribution pattern of the
urban village building community, high
building density, narrow streets and lanes, an image captured via Google at a
resolution of 0.11 m was selected as
the image data.
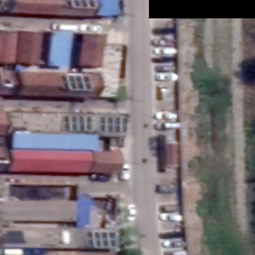
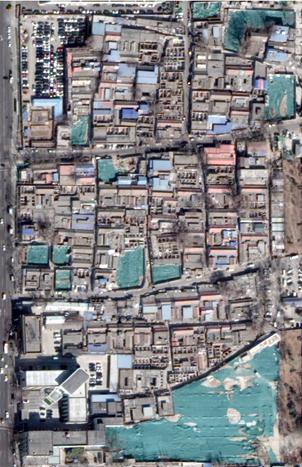
(2) Image segmentation
An image was divided into the target size, which was
generally an exponential square with side length of 2. The original image and
their labels were subset into 512 ?? 512 pixels for subsequent model training.
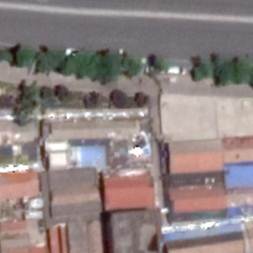
After the original image was segmented the pic file was obtained, which was the
sample??s original image set Buildingsample_pic, as shown in Figure 1-a.
(3) LabelMe
draws the buildings in the village in the city
Draw the outline of the building in LabelMe and mark
it in the form of vbuilding*. Each building is named
vbuilding1, vbuilding2, vbuilding3 in turn vbuilding*.
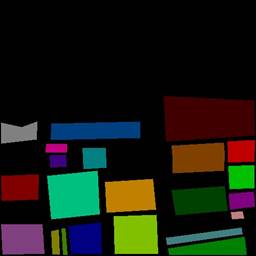
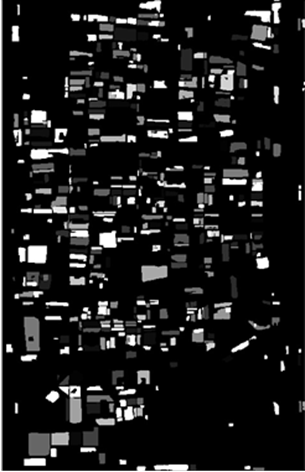
(4) Format conversion
According to the JSON file generated by LabelMe, the
sketch sample was converted to an executable dataset format. Next, the mask
images generated were sorted to derive the mask file of the instance
segmentation result, which was the sample??s
segmentation results (Buildingsample_mask), as shown in Figure 1-b. Instance
segmentation annotation information info file, which was the
sample??s segmentation annotation (Buildingsample_info) Each color shown
in Figure 1-b represents a building.
|
|
|
|
Figure 1-a Google image of the sample
|
|
Figure 1 Google image
and mask of the sample
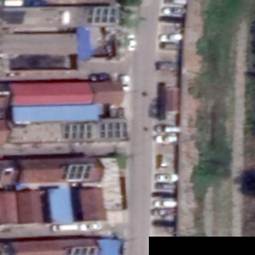
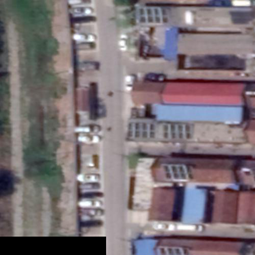
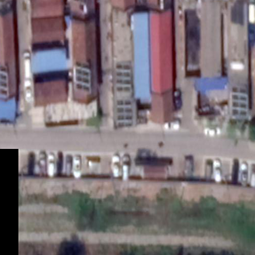
(5) Sample increase
The generated mask image (mask) and original image
(pic) were flipped horizontally, vertically, and rotated to 90??, rotated to
180??, and rotated to 270?? to increase the number of samples, as shown in Figure
2.
|
|
|
|
|
Figure 2-a Original image
|
Figure 2-b Horizontal flip
|
Figure 2-c Vertical flip
|
|
|
|
|
|
Figure 3-d Rotate to 90??
|
Figure 3-e Rotate to
180??
|
Figure 3-f Rotate to
270??
|
Figure 2 Schematic
diagram of data expansion
4 Data Results and Validation
4.1 Data Proudcts
The
dataset includes 3 data files (Table 2). A total of 2,328 urban village
building samples were drawn.
Table 2 File description
of the data product
|
No.
|
File name
|
Document
description
|
Data format
|
Data size (MB)
|
|
1
|
Buildingsample_pic
|
original sample
images
|
.png
|
488
|
|
2
|
Buildingsample_mask
|
sample
segmentation results
|
.png
|
10.6
|
|
3
|
Buildingsample_info
|
sample
segmentation annotation
|
.yaml
|
0.96
|
4.2 Validation
The
case segmentation algorithm, mask R-CNN, was used to extract building information[10-13], and 678 urban village building samples
were tested and verified. The algorithm of extracting village buildings in city
by mask R-CNN is shown in Figure 3.
|
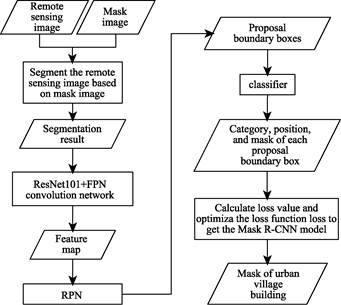
Figure 3 Mask
R-CNN for urban village building extraction
|
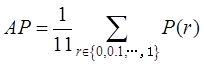
To evaluate the performance of the algorithm, average precision (AP) was
used as the evaluation metric of experimental accuracy. AP is the area formed
by the accuracy recall curve and X and Y axes, which is calculated by equation
(1). The higher the AP, the better the performance of the
model, and vice versa. Therefore, the calculation of AP involves the
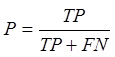
calculation of both precision (p) and
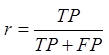
recall (r). The precision refers to
the ratio of TP (True Positive) to the number of all detected targets, as shown
in equation (2). Recall rate refers to the ratio of TP (True Positive) to all
actual target numbers, as shown in equation (3).
 (1)
(1)
 (2)
(2)
 (3)
(3)
Table
3 Evaluation metrics of
target detection
|
Name
|
Abbreviation
|
Description
|
|
True Positive
|
TP
|
Number of positive
samples detected correctly
|
|
True Negative
|
TN
|
Number
of negative samples correctly detected
|
|
False Positive
|
FP
|
Number
of negative samples detected as positive samples by error
|
|
False Negative
|
FN
|
Number
of positive samples detected as negative by error
|
|
Note: positive
samples refer to samples belonging to buildings; negative samples refer to
samples not belonging to buildings.
In order to find out the correct positive
samples and the false positive samples in the prediction results, we set the
IOU (Intersection Over Union) to judge the correctness of the test results,
and set the threshold value to 0.5. When the IOU > 0.5, the test results
are considered to be reliable, that is, the positive samples were correctly
detected; otherwise, it is a false positive in which a positive sample was
detected by mistake. The IOU was calculated by equation (4).
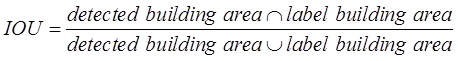 (4) (4)
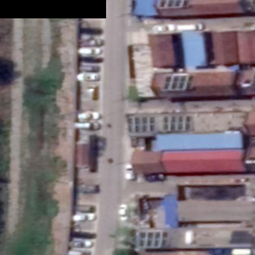
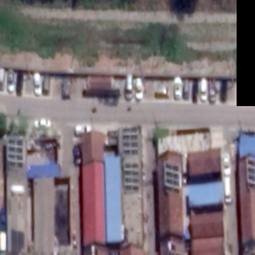
After
verification, the AP of the model was 0.66, and the maximum detection
accuracy AP of a single urban village building sample image reached 0.995. The
test results of building samples in urban villages are shown in Figure 4. The
test results fully demonstrate the effectiveness of the dataset quality.
|
|
|
|
|
Figure 5-a Google image
|
Figure 5-b Test result map
|
|
|
|
|
Figure 5 Comparison
images of the test results
The results show that the average building area of
the experimental area is 75.08 m2, and the average nearest-neighbor
distance is 0.90 m. According to the kernel density estimation results, the
building density of the studied area is 43.75%, and the green space rate is
5.12%[14]. According to the
national standard of the code for planning and design of urban residential
areas of China, the area is a high-density residential area[15].
5 Conclusion
The dataset is based on 0.11-m spatial resolution of remote sensing imagery
produced by Google Maps, for which the location, outline, and type of each
single building in a city??s village was marked.
According to the sample, we demo an application case of case segmentation of
single building in urban village. Our experimental results show the followings:
(1) The network structure of mask
R-CNN has advantages in building target detection. The dataset has high
practicability when using an instance segmentation algorithm mask R-CNN to
extract information by deep learning. The AP of the building sample in the
urban village reaches 0.66, and the highest detection accuracy AP of the single
image of the building sample in the urban village reaches 0.995. Through
testing and verifying 678 urban village building samples, the quality of the
urban village building sample datasetis proved to be effective, which provides
a sample deep learning case segmentation.
(2) The results of spatial analysis of the information
extraction show that the spatial analysis can effectively reflect the
distribution characteristics of small average building area, narrow streets,
high density of buildings and complex building types.
The dataset provides the basic data for the use of
remotely sensed images based on a deep learning algorithm to extract the
buildings in urban villages. It offers good practical
significance for studying the spatial distribution characteristics of urban
villages and the intelligent analysis and application of urban villages??
governance.
Author Contributions
Wu, T. designed the technical route of the dataset
development; Liu, Y. F. and Lu, B. R. collected and processed the sample data
of urban villages; Lu, B. R. designed the models and algorithms; Lu, B. R. and
Liu, S. validated the results; Peng, L. was responsible for data organization,
sample types, and production process, as well as value judgment; Liu, Y. F, and
Lu, B. R. wrote the manuscript.
References
[1]
Li, Z. Y., Yang, Y. C. Research progress of
urban village in China [J]. Gansu Science and Technology, 2008 (7): 7?C11.
[2]
Zhou, X. H. Urban village problem: an economic analysis of its
formation, existence and transformation [D]. Shanghai: Fudan University, 2007.
[3]
Deng, C. Y., Wang, Y. R. A review of the research on urban
villages in China [J]. Journal of Guangdong University of Administration,
2008, 20(1): 93?C97.
[4]
Zhao, Y. H., Chen, G. Q., Chen, G. L., et al. Extraction of urban village
buildings from multi-source big data: a case study of Tianhe district,
Guangzhou city [J]. Geography and Geographic
Information Science, 2018, 34 (5): 3, 13?C19.
[5]
Liang, Y. D. Research on the application of UAV system in urban
village reconstruction [J]. Beijing Surveying and Mapping, 2018,
32 (10): 70?C73.
[6]
Mayunga, S. D. Semi-automatic building extraction in informal
settlements from high-resolution satellite imagery [D]. Canada: University of
New Brunswick, 2006: 1?C298.
[7]
Cheng, T. Construction and application method of big data of
remote sensing image sample [J]. Application of Computer System, 2017,
26(5): 43-48.
[8]
Liu, Y. F, Lv, B. R., Peng, L., et al. Training samples dataset of building identification in urban
village [J/DB/OL]. Digital Journal of Global Change Data Repository,
2020. DOI: 10.3974/geodb.2020.02.16.V1.
[9]
GCdataPR Editorial Office. GCdataPR Data Sharing Policy [OL]. DOI:
10.3974/dp.policy.2014.05 (Updated 2017)
[10]
Ji, S. P., Wei, S. Q. Convolutional neural network and open source
dataset method for building extraction from remote sensing images [J]. Acta
Sinica Sinica, 2019, 48 (4): 50?C61.
[11]
Lin, T. Y., Doll??r, P., Girshick, R., et al. Feature pyramid networks for object detection. [C]. 2017
IEEE Conference on Computer Vision and Pattern Recognition (CVPR), IEEE
Computer Society, 2017.
[12]
Hirata, T., Kuremoto, T., Obayashi, M., et al. Deep belief network using reinforcement learning and its
applications to time series forecasting [C]. International Conference on Neural Information Processing. Springer
International Publishing, 2016.
[13]
Fu, F., Wei, J. Y., Zhang, L. N. Research on building extraction
from remote sensing image based on convolution network [J]. Software
Engineering, 2018, 21 (6): 8?C11.
[14]
Lv, B. R., Peng, L., Wu, T., et
al. Research on urban building extraction method based on deep learning
convolutional neural network [J]. Earth and Environmental Science, 2020,
502: 012022.
[15]
GB 50180??93. Code for planning and design of urban residential
areas [S]. Beijing: China Construction Industry Press, 2002.