Plant Production Potential Dataset at 0.25°Resolution in the Belt & Road and Surround Region (2015)
Zhang, Q.1, 2 Xin, X. Z.1* Zhang, H. L.1 Gong, W.1, 3 Li, L. 1 Liu, Q. H.1*
1. State Key Laboratory of Remote Sensing Science, Jointly Sponsored by Institute of Remote Sensing and Digital Earth of Chinese Academy of Sciences and Beijing Normal University, Beijing 100101, China;
2. University of Chinese Academy of Sciences, Beijing 100049, China;
3. Chongqing Normal University, Chongqing 400047, China
Abstract: Plant production potential refers to the maximum productivity that may be achieved per unit area in a local, natural environment at a certain period in time. This study estimates the plant production potential of “Belt & Road” and its adjacent areas, including Asia, Africa, Europe and Oceania. The method of the dataset development was discussed at this paper and the data results show that the light-temperature potential productivity of the Tibetan Plateau is below 30 t/ha, which is different from that of other areas at the same latitude due to its low temperature. The difference between the light-temperature and light-temperature-water potential productivities can reach 180 t/ha in the desert areas of middle-low latitudes, such as Africa’s Sahara Desert or the Arabian Peninsula. The resolution of the dataset is 0.25°, the storage format is .tif, and the data size is 7.5 MB (the compressed dataset is 1,034 KB).
Keywords: Belt & Road region; light-temperature potential productivity; light-temperature-water potential productivity
1 Introduction
Climate production potential refers to the maximum productivity that may be achieved per unit area in a local natural environment at a certain period in time and provided that the conditions of the crop varieties, soil properties and farming techniques are suitable. Like the climate production potential, the vegetation production potential in this paper is the maximum productivity that vegetation can achieve, which can clarify the impact of different climatic factors on vegetation productivity. Solar radiation, temperature and water are indispensable climatic factors for plant growth, and plant production potential depends on the quantity of light, temperature and water and the degree of coordination among these three factors. Solar radiation is the energy source for vegetation production and influences the production potential size. The photosynthetic productive potential only considering solar radiation is the maximum productivity in theory, but it is far from the actual productivity. Temperature is an important climatic resource that affects the growth and development of vegetation. Suitable temperature conditions contribute to improving plant production potential. The photosynthetic productive potential was revised using temperature conditions to obtain the light-temperature potential productivity. Water plays an important role in the growth and development of vegetation and is the key factor that restricts vegetation production potential. Whether or not water conditions are met directly affects the utilization of light and temperature resources in an area. The light-temperature potential productivity was
revised by incorporating water conditions to obtain the light-temperature-water potential productivity.
The Belt & Road region stretch across a number of climatic zones with notable
differences in topography and diverse types of vegetation, and the light, temperature and water conditions of the Belt & Road region are distinctly different in their spatial distributions. Based on solar shortwave radiation data, monthly average temperature, monthly average precipitation, and monthly average evaporation, the spatial analysis function of ArcGIS were used to develop the dataset.
2 Metadata of Dataset
The metadata of the plant production potential dataset for the Belt & Road region (PPP_B&R) are summarized in Table 1.
3 Methods
3.1 Algorithm
Based on light, temperature and water conditions, this study used the methods from Wang, J. Y. and Liu, Q., et al. to measure the vegetation production potential. The general method of estimating climate production potential is to calculate the photosynthetic productive potential of a crop based on total solar radiation data, and then this value is revised using temperature conditions to obtain the light-temperature potential productivity. Then, the light-
temperature potential productivity is revised using water conditions to obtain the light-
temperature-water potential productivity. The continuous distribution principle is used to estimate the plant production potential,
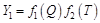
 (1)
(1)
where Y represents the potential productivity, f1, f2, f3 represent the correction functions of light, temperature and water factors, respectively, Q, T, W, E represent the total solar radiation, the average temperature, the precipitation and the evaporation, respectively.
Photosynthetic productive potential is defined as
 (2)
(2)
where Q represents the total solar radiation, ε represents the proportion of photosynthetically active radiation, α represents the absorption rate of radiation by crop groups, β represents the leakage rate, ρ represents the invalid absorption rate of non-photosynthetic organs, γ represents the saturation limit for the use of light energy, ω represents the respiratory loss, φ represents the quantum efficiency, 17,765 kJ/kg indicates that 17,765 kJ of energy is consumed to generate 1 kg of dry matter, (1-8%)‒1 indicates that plant inorganic nutrients consume approximately 8% of the dry matter.
Table 1 Metadata summary of potential plant production dataset in the Belt & Road region (2015)
|
Items
|
Description
|
|
Dataset full name
|
Plant production potential dataset at 0.25° resolution in “the Belt and Road” and surround region
|
|
Dataset short name
|
B&RPlantProucPotential
|
|
Authors
|
Zhang, Q. M-9694-2017, Institute of Remote Sensing and Digital Earth, Chinese Academy of Sciences, 2270211857@qq.com
Xin, X. Z. S-3681-2016, Institute of Remote Sensing and Digital Earth, Chinese Academy of Sciences, xin_xzh@163.com
Zhang, H. L. L-6186-2016, Institute of Remote Sensing and Digital Earth, Chinese Academy of Sciences, zhlnjnu@163.com
Gong, W. Q-8293-2017, Institute of Remote Sensing and Digital Earth, Chinese Academy of Sciences, 1271129410@qq.com
Li, L. S-4533-2016, Institute of Remote Sensing and Digital Earth, Chinese Academy of Sciences, lili3982@163.com
Liu, Q. H. S-1647-2016, Institute of Remote Sensing and Digital Earth, Chinese Academy of Sciences, liuqh@radi.ac.cn
|
|
Geographical region
|
Asia, Europe, Africa and Oceania
|
|
Year
|
2015 Spatial resolution 0.25°
|
|
Data format
|
.tif Data size 7.5 MB
|
Data files 2
|
|
|
Foundation(s)
|
National Natural Science Foundation of China (41201352, 41771394)
|
|
Data publisher
|
Global Change Research Data Publishing & Repository, http://www.geodoi.ac.cn
|
|
Address
|
No. 11A, Datun Road, Chaoyang District, Beijing 100101, China
|
|
Data sharing policy
|
Data from the Global Change Research Data Publishing & Repository includes metadata, datasets (data products), and publications (in this case, in the Journal of Global Change Data & Discovery). Data sharing policy includes: (1) Data are openly available and can be free downloaded via the Internet; (2) End users are encouraged to use Data subject to citation; (3) Users, who are by definition also value-added service providers, are welcome to redistribute Data subject to written permission from the GCdataPR Editorial Office and the issuance of a Data redistribution license, and; (4) If Data are used to compile new datasets, the ‘ten percent principal’ should be followed such that Data records utilized should not surpass 10% of the new dataset contents, while sources should be clearly noted in suitable places in the new dataset[6]
|
The Light-temperature potential productivity is defined as
 (3)
(3)
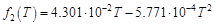 (4)
(4)
where T represents half of the sum of the monthly average maximum temperature and the monthly mean temperature and indicates the average temperature at which photosynthesis occurs.
The light-temperature-water potential productivity is defined as
 (5)
(5)
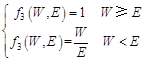 (6)
(6)
where W represents the precipitation, E represents the evaporation.
|
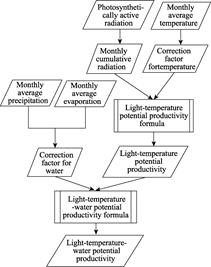
Figure 1 Flowchart of the plant production potential estimation
|
3.2 Algorithm Implementation
By using the photosynthetic productive potential and light-temperature potential productivity formulas, the light-temperature potential productivity was estimated based on photosynthetically active radiation and monthly average temperature data from 2015. By using the light-temperature-water potential productivity formula, the light-temperature-water potential productivity was estimated based on the light-temperature potential productivity, monthly average precipitation and monthly average evaporation data from 2015 (Figure 1).
4 Data Results
4.1 Light-temperature Potential Productivity Data
|
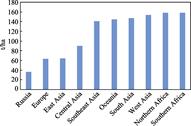
Figure 2 The average values of light-temperature potential productivities in regions
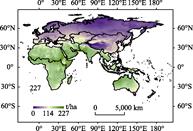
Figure 3 Light-temperature potential productivity data (2015)
|
The maximum value of the light-temperature potential productivity of “the Belt and Road” and its adjacent areas is 227.6 t/ha, the minimum value is 0, and the average value is 98.9 t/ha. The average values of the light-temperature potential productivity calculated for the geographic areas are shown in Figure 2.
The spatial distribution of the light-temperature potential productivity of the Best & Road region shows the characteristics of the high southwest and low northeast. Due to the high altitude and low annual average temperatures, the light-temperature potential productivity of the Tibetan Plateau is low and below 30 t/ha, while the light-temperature potential productivities of other regions have similar spatial distributions as the total solar radiation.
4.2 Light-temperature-water Potential Productivity Data
The maximum value of the light-temperature- water potential productivity of the Belt & Road region is 174.5 t/ha, the minimum value is 0, and the average value is 44.9 t/ha. The average values of the light-temperature-water potential productivity in regions are shown in Figure 4.
5 Conclusion
The dataset reveals the stress effect of temperature and water conditions on vegetation in terms of utilizing light energy resources. The spatial distribution of the light-temperature potential productivity demonstrates the characteristics of the high southwest and low northeast. Due to the high altitude and low annual average temperatures, the light-temperature potential productivity of the Tibetan Plateau is below 30 t/ha, which is obviously different compared with the light-temperature potential productivity in areas at the same latitude.
Author Contributions
|
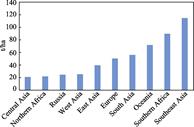
Figure 4 The average of light-temperature-water potential productivities in regions
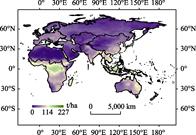
Figure 5 Light-temperature-water potential productivity data (2015)
|
Liu, Q. H., Xin, X. Z., Zhang, H. L. designed the algorithms of dataset. Gong, W. collected and processed data and made maps. Zhang, Q., Zhang, H. L., and Li, L. completed the data analysis and wrote the data paper.
References
[1] Li, S. K., Hou, G. L., Ouyang, H., et al. China’s Agricultural Climate Resources and Agricultural Climate Planning [M]. Science Press, 1998: 124-139.
[2] Xin, N. Q., Wang, L. X. Arid Area Agriculture in Northern China [M]. Jiangsu Science and Technology Press, 1998: 150-164.
[3] Mu, X. Y. Analysis of soil productivity potential and the study of improved measures in development zone Luyang Lake of Weinan, Shanxi [D]. Yangling: Northwest Agriculture and Forestry University, 2013.
[4] Hou, Y. B. The studies on the potential productivity and technology approach for increasing yield of maize in Henan province [D]. Zhengzhou: Henan Agricultural University, 2007.
[6] GCdataPR Editorial Office. GCdataPR data sharing policy [OL]. DOI: 10.3974/dp.policy.2014.05 (Updated 2017).
[7] Wang, J. Y., Zhao, Y. J., Chen, Y. C., et al. Evaluation on solar radiation resource and photosynthetic and thermal potential productivity in Shandong province [J]. Journal of Anhui Agricultural Sciences, 2010, 11(2): 3581-3583. DOI: 10.3969/j.issn.0517-6611.2010.07.100.
[8] Liu, Q., Yan, C. R., He, W. Q., et al. Studies on potential climate productivity of dryland farming in Shouyang county of Shanxi province [J]. Chinese Journal of Agrometeorology, 2007, 28(3): 271-274. DOI: 10.3969/j.issn.1000-6362.2007.03.009.