The Dataset of Indirect Carbon Emissions of
Urban Residents in Provinces of China
Cui, P. P.1,2 Zhang, L. J.1*
1. College of Environment and Planning, Henan University, Kaifeng 475004, China;
2. School of Geographic Science, Nanjing Normal University, Nanjing 210023, China
Abstract: Based on the input-output tables of provinces of China (no data available from Tibet, Taiwan, Hong Kong and Macao), the dataset of indirect carbon emissions (ICEs) of urban residents in provinces of China is developed. Using the input-output method to calculate ICEs, this study constructs the ICE equality and uses the LMDI-I (Logarithmic Mean Divisia Index) method to decompose the drivers of ICEs change into four categories: consumption level effects, population scale effects, ICE intensity effects, and residents’ lifestyle effects. Then, the temporal and spatial characteristics of ICEs are analyzed. The dataset includes the followings: (1) ICEs of urban residents in provinces of China; and (2) consumption level effects, population scale effects, ICE intensity effects, the residents’ lifestyle effects, and the corresponding relation between the industrial sector in the input-output table and the energy consuming industrial sector in the statistical yearbook. There is only one file in Excel format and 52.5 KB in size. The dataset shows the followings: (1) All provinces but Jilin show growing ICEs; (2) the effect of consumption level is one of the most important influencing factors for increasing ICEs; (3) the size of the population has a mixed effect on ICEs; (4) the most important factor that caused the reduction of ICEs in most provinces is the ICE intensity effects; and (5) the changes of the residents’ lifestyle contribute little to ICEs.
Keywords: China; province; urban residents; indirect carbon emissions; Journal of Natural Resources
1 Introduction
With the mounting attention to the quality of population urbanization[1], it has become a focus of research to improve residents’ living standards with only moderate indirect carbon emissions (ICEs) increase. At present, the methods of measuring ICEs mainly include the consumer product lifecycle method[2–3], the consumer lifestyle method[4–5], and the input-output method[6–9]. Of these, the input-output analysis is the most widely used method. In term of the drivers of ICEs, some scholars use grey correlation analysis[10] and multivariate regression analysis[11]. And the structural decomposition[7–12] and the LMDI[13–14] are more widely used. By analyzing the spatial and temporal evolution of influencing factors of ICEs, we can better identify the key areas and key factors to curb ICEs.
2 Metadata of Dataset
The metadata of the ICEs dataset based on urban residents in provincial level of China[15] is summarized in Table 1, including the dataset full name, short name, authors, year, temporal resolution, data format, data size, data files, data publisher, data sharing policy, etc.
Table 1 Metadata summary of ICEs dataset based on urban residents in provincial level of China
|
Items
|
Description
|
|
Dataset full name
|
Indirect carbon emissions dataset based on urban residents in provincial level of China
|
|
Dataset short name
|
CarbonEmissionUrbanResidentProvChina
|
|
Authors
|
Cui, P. P. X-9461-2018, College of Environment and Planning, Henan University; School of Geographic Science, Nanjing Normal University, cuipan3353@163.com
Zhang, L. J. X-9839-2018, College of Environment and Planning, Henan University, zlj7happy@163.com
|
|
Geographical region
|
Urban areas in 30 Chinese provinces (excluding Hong Kong, Macao, Taiwan, and Tibet)
|
|
Year
|
2002, 2007, 2012
|
|
Data format
|
.xls Data size 52.5 KB
|
|
Data files
|
Including 3 Excel files: 1. The data of indirect carbon emissions of urban residents in 30 Chinese provinces; 2. The data of consumption level effects, population scale effects, indirect carbon emission effects, and resident lifestyle effects; 3. The corresponding relation between the industrial sector in the input-output table and the energy consuming industrial sector in the statistical yearbook
|
|
Foundations
|
National Science Foundation of China (41501588, 41671536); China Postdoctoral Science Foundation (2016M600575); Henan Province (2014CJJ065, 17A170006)
|
|
Data publisher
|
Global Change Research Data Publishing & Repository, http://www.geodoi.ac.cn
|
|
Address
|
No. 11A, Datun Road, Chaoyang District, Beijing 100101, China
|
|
Data sharing policy
|
Data from the Global Change Research Data Publishing & Repository includes metadata, datasets (data products), and publications (in this case, in the Journal of Global Change Data & Discovery). Data sharing policy includes: (1) Data are openly available and can be Downloaded for free via the Internet; (2) End users are encouraged to use Data subject to citation; (3) Users, who are by definition also value-added service providers, are welcome to redistribute Data subject to written permission from the GCdataPR Editorial Office and the issuance of a Data redistribution license; and (4) If Data are used to compile new datasets, the ‘ten percent Principal’ should be followed such that Data records utilized should not surpass 10% of the new dataset contents, while sources should be clearly noted in suitable places in the new dataset[16]
|
3 Methods of Data Development
3.1 Algorithm Principle
In this paper, based on relevant references[13,17], the research results were formed[15,18]. The specific steps include the followings: (1) Combining the actual situation of the data, the 42 industrial sectors in the input-output table are merged into 29 sectors; and (2) the 29 industrial sectors resulting from the merging corresponds to energy consumption sectors in the Provincial Statistical Yearbooks. And the ICE intensity of the eight consumption categories of urban residents can be obtained from the average value of the relevant industrial sector in the input-output table.
Using the input-output method to calculate ICEs, this study constructs the ICE equality and uses the LMDI-I method to decompose the drivers of ICEs change into the consumption level effects, population scale effects, ICE intensity effects, and residents’ lifestyle effects.
3.2 Methods
3.2.1 Input-output Method
The ICEs of urban residents in each province were calculated by the input-output method. The formulas are as follows:
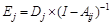 (1)
(1)
 (2)
(2)
where Ej is the ICE intensity for sector j in the input-output table, (104 t/104 Yuan), and it can represent the total carbon emissions of all industrial sectors required for unit output; Dj is the direct carbon emission intensity for sector j in the input-output tables (104 t/104 Yuan); (I-A)-1 is the Leontiff inverse matrix; Aij is the direct energy consumption coefficient matrix, and I is the unit matrix with the same order as the A. In formula (2), C is ICEs for urban resident consumption (104 t); k represents the categories of consumption of urban residents, k = 1, 2, 3, …, 8. (The statistics of consumption on the daily living expenses of each household in the provincial statistical yearbooks include food, clothing, housing, household equipment and services, health care, transportation and communications, education, cultural and recreational services, and other goods and services.) Ek is the ICE intensity of the kth consumption type of urban residents (104 t/104 Yuan), and Fk is the urban residents’ consumption of the kth consumption type (104 Yuan).
3.2.2 LMDI-I Method
Firstly, the ICE equality is constructed as follows:
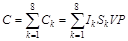 (3)
(3)
where I is the ICE intensity (104 t/104 Yuan), S is the residents’ lifestyle (%), V is the consumption level (104 Yuan), P is the population scale (104 people), and k is the same as above.
Secondly, the LMDI-I analysis method is used to decompose the change of ICEs:
 (4)
(4)
where ∆C is the change in ICEs for year t; and Ct and C0 are ICEs for the base period and reporting period, respectively.
 (5)
(5)
where ∆CI is the contribution of the ICE intensity I to the change of C, representing the ICE intensity effects.
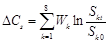 (6)
(6)
where ∆CS is the contribution of the residents’ lifestyle to the change of C, representing the residents’ lifestyle effects.
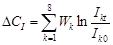
 (7)
(7)
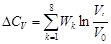
where ∆CV is the contribution of the consumption level to the change of C, representing the consumption level effects.
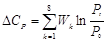 (8)
(8)
where ∆CP is the contribution of the population to the change of C, representing the population scale effects.
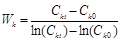 (9)
(9)
where Wk is the weight of consumption type k.
4 Data Results
4.1 Dataset Composition
This dataset size with 52.5 KB is archived in. xls format. The dataset includes the ICEs of urban residents in 30 provinces of China in 2002, 2007, and 2012; the data of consumption level effects, population scale effects, ICE intensity effects, residents’ lifestyle effects, and the corresponding relation between the industrial sector in the input-output table and the energy consumption of the industrial sector is from the Provincial Statistical Yearbooks.
4.2 Data Results
1) The data of Chinese urban residents’ ICEs of 30 provinces in 2002, 2007, and 2012. Figures 1 and 2 demonstrate the amount and the average annual growth rate, respectively, of ICEs of Chinese urban residents in 30 provinces in 2002, 2007 and 2012.
2) The date of increment and its influencing factors on the ICEs of Chinese urban residents from 2002−2007, 2007−2012, and 2002−2012. Tables 2-4 demonstrate the increment of ICEs and the effect of lifestyle, consumption level, population scale and ICE intensity of Chinese urban residents for these three time periods.
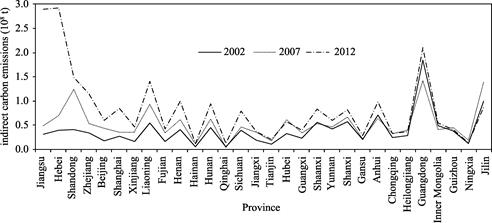
Figure 1 ICEs of urban residents in 30 provinces of China
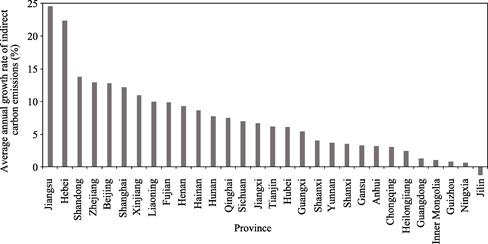
Figure 2 Average annual growth rate of ICEs of urban residents in 30 provinces of China
Table 2 Increment and decomposition effects of indirect carbon emissions from 2002 to 2007 (104 t)
|
Province
|
Increment of indirect carbon emissions
|
Indirect carbon emission intensity effects
|
Residents’ lifestyle effects
|
Consumption level effects
|
Population scale effects
|
|
Anhui
|
–742.28
|
–2,777.09
|
83.88
|
3,946.41
|
–1,995.48
|
|
Beijing
|
2,634.87
|
957.979
|
–157.55
|
1,231.56
|
602.88
|
|
Fujian
|
1,742.23
|
210.64
|
31.10
|
1,213.97
|
286.53
|
|
Gansu
|
144.89
|
–1,205.87
|
–10.02
|
928.14
|
432.64
|
|
Guangdong
|
–4,209.69
|
–13,768.01
|
–6.55
|
7,108.44
|
2,456.43
|
|
Guangxi
|
1,034.76
|
–712.87
|
–90.73
|
1,165.88
|
672.48
|
|
Guizhou
|
785.59
|
–1,871.23
|
–49.76
|
2,165.97
|
540.61
|
|
Hainan
|
531.75
|
70.07
|
39.01
|
306.28
|
116.40
|
|
Hebei
|
3,138.51
|
–625.90
|
9.58
|
2,550.23
|
1,204.59
|
|
Henan
|
2,081.51
|
–1,834.50
|
–128.95
|
2,753.17
|
1,291.79
|
|
Heilongjiang
|
1,121.36
|
–654.78
|
–41.96
|
1,727.95
|
90.16
|
|
Hubei
|
2,893.39
|
802.77
|
–74.51
|
1,857.99
|
307.14
|
|
Hunan
|
1,764.39
|
–1,661.57
|
–133.23
|
2,538.12
|
1,021.06
|
|
Jilin
|
4,021.01
|
–1,979.07
|
–22.58
|
6,400.14
|
–377.47
|
|
Jiangsu
|
1,741.79
|
–1,426.48
|
40.46
|
2,298.35
|
829.46
|
|
Jiangxi
|
1,573.81
|
–474.90
|
–26.15
|
1,426.57
|
648.28
|
|
Liaoning
|
3,811.73
|
–975.24
|
150.20
|
4,023.82
|
612.95
|
|
Inner Mongolia
|
–732.34
|
–4,076.03
|
–162.45
|
2,881.52
|
624.61
|
|
Ningxia
|
616.27
|
–516.44
|
–8.06
|
652.82
|
487.95
|
|
Qinghai
|
–103.47
|
–334.74
|
–17.64
|
197.67
|
51.24
|
|
Shandong
|
8,345.04
|
3,179.72
|
32.16
|
4,027.76
|
1,105.39
|
|
Shanxi
|
945.70
|
–3,596.57
|
119.78
|
3,345.36
|
1,077.14
|
|
Shaanxi
|
–303.84
|
–3,582.82
|
–134.04
|
2,438.53
|
974.48
|
|
Shanghai
|
869.10
|
–2,298.96
|
159.43
|
1,533.84
|
1,474.79
|
|
Sichuan
|
631.94
|
–2,155.33
|
27.92
|
2,037.03
|
722.31
|
|
Tianjin
|
592.03
|
–320.57
|
10.66
|
700.22
|
201.72
|
|
Xinjiang
|
1,948.53
|
599.13
|
–80.19
|
830.89
|
598.70
|
|
Yunnan
|
534.32
|
–1791.21
|
–70.88
|
1,356.55
|
1,039.86
|
|
Zhejiang
|
1,870.50
|
–979.25
|
150.54
|
2,041.46
|
657.75
|
|
Chongqing
|
924.23
|
–1,122.35
|
–24.25
|
1,524.21
|
546.62
|
Table 3 Increment and decomposition effects of indirect carbon emissions from 2007 to 2012 (104 t)
|
Province
|
Increment of indirect carbon emissions
|
Indirect carbon emission intensity effects
|
Residents’ lifestyle effects
|
Consumption level effects
|
Population scale effects
|
|
Anhui
|
3,403.31
|
–2,288.24
|
–74.54
|
4,482.21
|
1,283.88
|
|
Beijing
|
1,525.21
|
–2,018.58
|
14.56
|
2,244.15
|
1,285.09
|
|
Fujian
|
808.39
|
–1,937.54
|
–108.09
|
1,933.27
|
920.75
|
|
Gansu
|
635.87
|
–1,031.13
|
–10.94
|
1,210.51
|
467.43
|
|
Guangdong
|
6,754.71
|
–3,967.48
|
–139.54
|
7,743.37
|
3,118.36
|
|
Guangxi
|
619.03
|
–2,057.39
|
9.17
|
2,058.66
|
608.59
|
|
Guizhou
|
–467.03
|
–3,234.12
|
–49.40
|
2,058.66
|
757.83
|
|
Hainan
|
169.80
|
–545.15
|
–26.35
|
595.80
|
145.50
|
|
Hebei
|
22,265.95
|
12,487.13
|
180.88
|
6,509.61
|
3,088.33
|
|
Henan
|
3,806.50
|
–2,241.14
|
–88.22
|
4,429.91
|
1,705.95
|
|
Heilongjiang
|
–330.29
|
–2,573.95
|
–34.73
|
2,062.92
|
215.47
|
|
Hubei
|
–314.82
|
–4,256.10
|
–29.38
|
2,842.51
|
1,128.16
|
|
Hunan
|
3,196.34
|
–1,974.44
|
–23.32
|
3,754.49
|
1,439.61
|
|
Jilin
|
–5,218.62
|
–11,098.11
|
–239.24
|
5,922.07
|
196.66
|
|
Jiangsu
|
24,016.58
|
13,907.50
|
–89.09
|
7,458.58
|
2,739.60
|
|
Jiangxi
|
186.07
|
–2,356.01
|
25.03
|
1,769.01
|
748.05
|
|
Liaoning
|
4,819.43
|
–2,845.60
|
–165.03
|
6,417.46
|
1,412.59
|
|
Inner Mongolia
|
1,298.70
|
–2,638.56
|
7.51
|
3,089.08
|
840.68
|
|
Ningxia
|
–527.40
|
–1,738.04
|
–23.77
|
922.90
|
311.51
|
|
Qinghai
|
712.58
|
173.79
|
6.50
|
375.39
|
156.90
|
|
Shandong
|
2,453.43
|
–6,102.45
|
–109.72
|
6,654.24
|
2,011.36
|
|
Shanxi
|
1,454.21
|
–3,171.70
|
12.98
|
3,030.36
|
1,582.56
|
|
Shaanxi
|
3,027.16
|
–2,321.49
|
–86.60
|
4,025.32
|
1,409.94
|
|
Shanghai
|
4,970.12
|
1,202.52
|
–55.67
|
2,379.36
|
1,443.92
|
|
Sichuan
|
3,261.74
|
–1,300.15
|
31.21
|
3,342.97
|
1,187.70
|
|
Tianjin
|
336.51
|
–1,201.34
|
14.81
|
955.33
|
567.70
|
|
Xinjiang
|
1,078.23
|
–1,951.89
|
–22.10
|
2,317.21
|
735.90
|
|
Yunnan
|
1,287.06
|
–3,243.53
|
232.28
|
2973.53
|
1,324.78
|
|
Zhejiang
|
6,249.16
|
1,445.79
|
–0.77
|
3,379.92
|
1,424.22
|
|
Chongqing
|
–69.40
|
–1,996.06
|
–154.92
|
1,390.41
|
691.17
|
Table 4 Increment and decomposition effects of indirect carbon emissions from 2002 to 2012(104 t)
|
Province
|
Increment of indirect carbon emissions
|
Indirect carbon emission intensity effects
|
Residents’ lifestyle effects
|
Consumption level effects
|
Population scale effects
|
|
Anhui
|
2,661.03
|
–5,847.62
|
28.27
|
9,611.34
|
–1,130.97
|
|
Beijing
|
4,160.09
|
–415.05
|
33.15
|
2,930.87
|
1,611.13
|
|
Fujian
|
2,550.62
|
–1,126.07
|
–27.27
|
2,729.16
|
974.80
|
|
Gansu
|
780.76
|
–2,381.86
|
–5.16
|
2,224.42
|
943.36
|
|
Guangdong
|
2,545.03
|
–20,376.06
|
–450.03
|
17,015.89
|
6,355.23
|
|
Guangxi
|
1,653.78
|
–2,563.06
|
–41.94
|
3,010.64
|
1,248.15
|
|
Guizhou
|
318.56
|
–4,746.83
|
–57.07
|
3,920.64
|
1,201.82
|
|
Hainan
|
701.55
|
–333.10
|
–34.23
|
820.62
|
248.25
|
|
Hebei
|
25,404.46
|
8,637.88
|
279.82
|
11,190.29
|
5,296.47
|
|
Henan
|
5,888.01
|
–4,099.03
|
–213.15
|
7,149.10
|
3,051.08
|
|
Heilongjiang
|
791.07
|
–2,836.04
|
–35.49
|
3,394.72
|
267.87
|
|
Hubei
|
2,578.57
|
–2,628.44
|
–122.63
|
4,132.17
|
1,197.48
|
|
Hunan
|
4,960.73
|
–3,679.29
|
–227.96
|
6,367.06
|
2,500.92
|
|
Jilin
|
–1,197.60
|
–10,835.89
|
–206.51
|
9,976.82
|
–132.02
|
|
Jiangsu
|
25,758.38
|
8,018.29
|
113.50
|
12,921.10
|
4,704.58
|
|
Jiangxi
|
1,759.87
|
–2,277.38
|
–3.16
|
2,807.03
|
1,233.38
|
|
Liaoning
|
8,631.15
|
–3,561.35
|
75.15
|
10,215.84
|
1,901.51
|
|
Inner Mongolia
|
566.36
|
–7,339.14
|
–256.40
|
6,558.68
|
1,603.23
|
|
Ningxia
|
88.87
|
–1,838.47
|
–41.98
|
1,304.31
|
665.02
|
|
Qinghai
|
609.10
|
–337.63
|
–45.46
|
736.41
|
255.78
|
|
Shandong
|
10,798.47
|
–239.65
|
58.41
|
8,527.30
|
2,452.41
|
|
Shanxi
|
2,399.92
|
–6,850.62
|
56.82
|
6,528.51
|
2,665.21
|
|
Shaanxi
|
2,723.32
|
–6,863.65
|
–268.83
|
7,186.55
|
2,669.25
|
|
Shanghai
|
5,839.22
|
–2,616.72
|
161.91
|
4,608.58
|
3,685.46
|
|
Sichuan
|
3,893.68
|
–3,983.06
|
–3.034
|
5,815.49
|
2,064.28
|
|
Tianjin
|
928.54
|
–1,322.47
|
48.78
|
1,528.85
|
673.39
|
|
Xinjiang
|
3,026.76
|
–715.96
|
–47.85
|
2,584.22
|
1,206.36
|
|
Yunnan
|
1,821.38
|
–5,047.21
|
105.93
|
4,337.69
|
2,424.96
|
|
Zhejiang
|
8,119.66
|
–316.57
|
301.78
|
5,943.14
|
2,191.31
|
|
Chongqing
|
854.83
|
–2,838.96
|
–125.64
|
2,690.63
|
1,128.79
|
5 Discussion and Conclusion
The ICEs is an important part of resident carbon emissions. It can not only better reflect the responsibility of reducing carbon emissions and meet the needs of carbon emission assessment, but it can also more accurately reflect the impact of human consumption behavior on climate change. It is the basis for formulating reasonable and feasible carbon emission reduction policies. Therefore, based on the input-output table, we can calculate the ICEs caused by household consumption and decompose the drivers of ICEs change into four categories. Noting that in calculating the direct carbon emission intensity (Dj) of various sectors, the total energy consumption (standard coal consumption) is calculated because of the difficulties to obtain the energy consumption of different categories in different industrial sectors. The conversion coefficient of standard coal to CO2 is 2.497 kg/kg[18].
Author Contributions
Cui, P. P. and Zhang, L. J. carried out the overall design for the development of the dataset; Cui, P. P. collected and processed the data and designed the models and algorithms; Cui, P. P. conducted data validation, and wrote the data paper.
References
[1] Xu, D. S., Zeng, J. X. Evaluation of China’s urbanization quality and analysis of its spatial pattern transformation based on the modern life index [J]. Acta Geographica Sinica, 2016, 71(2): 194-204.
[2] Heinonen, J., Junnila, S. Implications of urban structure on carbon consumption in metropolitan areas [J]. Environmental Research Letters, 2011, 6(1): 014018.
[3] Liu, J. R., Peters, G. P., Wang, R. S., et al. Hybrid life-cycle analysis and its applications in sustainable consumption researches [J]. Acta Ecologica Sinica, 2007, 27(12): 5331-5336.
[4] Yang, X. M., Ge, Y. S., Zeng, H. Y. The household carbon emission analysis under individual consumer behavior [J]. China Population, Resources and Environment, 2010, 20(5): 35-40.
[5] Feng, Z. H., Zou, L. L., Wei, Y. M. The impact of household consumption on energy use and CO2 emissions in China [J]. Energy, 2010, 36(1): 656-670.
[6] Markaki, M., Belegri-Roboli, A., Sarafidis, Υ., et al. The carbon footprint of Greek households (1995–2012) [J]. Energy Policy, 2017, 100: 206-215.
[7] Zhu, Q., Peng, X., Wu, K. Calculation and decomposition of indirect carbon emissions from residential consumption in China based on the input-output model [J]. Energy Policy, 2012, 48(3): 618-626.
[8] Fan, J., Guo, X., Marinova, D., et al. Embedded carbon footprint of Chinese urban households: structure and changes [J]. Journal of Cleaner Production, 2012, 33(8): 50-59.
[9] Liu, Y., Liu, D., Zhang, L. X. Driving factors analysis of carbon emissions in Chinese provincial urban households [J]. Scientia Geographica Sinica, 2016, 36(5): 691-696.
[10] Liu, L. N., Qu, J. S., Zeng, J. J., et al. Application of gray relational analysis method in the influencing factor analysis of China’s rural household carbon emissions [J]. Ecology & Environmental Sciences, 2013, 22(3): 498-505.
[11] Ala-Mantila, S., Heinonen, J., Junnila, S. Relationship between urbanization, direct and indirect greenhouse gas emissions, and expenditures: a multivariate analysis [J]. Ecological Economics, 2014, 104(3): 129-139.
[12] Wu, K. Y., Wang, W. X., Zhang, H., et al. Indirect carbon emissions of Shanghai’s residents consumption and its influence factors [J]. East China Economic Management, 2013, 27(1): 1-7.
[13] Huang, F., Jiang, K. S. An analysis of the dynamic characteristics and the influential factors of carbon emissions from residential consumptions in China [J]. Systems Engineering, 2013, 63(1): 52-60.
[14] Zha, D. L., Zhou, D. Q., Peng, Z. Driving forces of residential CO2, emissions in urban and rural China: an index decomposition analysis [J]. Energy Policy, 2010, 38(7): 3377-3383.
[15] Cui, P. P., Zhang, L. J. Indirect carbon emissions dataset based on urban residents in provincial level of China [DB/OL]. Global Change Research Data Publishing & Repository, 2018. DOI: 10.3974/geodb.2018.05.11.V1.
[16] GCdataPR Editorial Office. GCdataPR data sharing policy [OL]. DOI: 10.3974/dp.policy.2014.05 (Updated 2017).
[17] Dong, H. J., Geng, Y. Study on carbon footprint of the household consumption in Beijing based on input- output analysis [J]. Resources Science, 2012, 34(3): 494-501.
[18] Cui, P. P., Zhang, Y. P., Zhang, L. J., et al. Analysis of the spatial and temporal evolution on indirect carbon emissions and its driving mechanism in China [J]. Journal of Natural Resources, 2018, 33(5): 879-892.