Spatial Dynamics of COVID-19 Pandemic in China: Effects of Human
Mobility and Control Measures
Liu, T.1,2 Chen,
J. C.1,2 Jin, Y. A.3* Xiao, W.1,2
1. College of Urban and Environmental
Sciences, Peking University, Beijing 100871, China;
2. Center for Urban Future Research, Peking University, Beijing 100871, China;
3. Center for
Population and Development Studies, Renmin University of China, Beijing 100872,
China
Abstract: This study aims to analyze the
spatio-temporal dynamics of COVID-19 pandemic in China, the heterogeneous
effects of human mobility, and the effectiveness of prevention and control
policies. Results show that leapfrogging spreading is dominant in the outbreak
stage of the pandemic, whereas adjacent spreading is dominant thereafter. Their
combination leads the pandemic to reach its peak, eventually forming three
types of pandemic hot spots, namely, developed provinces and cities,
surrounding provinces, and populous provinces. Moreover, early signs of
pandemic import have been observed in the border areas. The return of long-term
migrant workers and businessmen for family reunion in the Spring Festival and
short-term business tour flow has heterogeneous effects on the development of
the pandemic in different regions and various stages. The positive interaction
between sanitary and anti-epidemic work and social governance system is the key
to the success of pandemic prevention and control. Lastly, this research
discusses the discipline advantages of geography in spatio-temporal dynamic
analysis, key role of the structural analysis of human mobility in interpreting
the epidemic spreading mechanism and building a public health emergency system,
and importance of the complementary integration of big data and traditional
data.
Keywords: COVID-19 pandemic; human
mobility; spatial dynamics; policy assessment; big data
Dataset Availability Statement:
The dataset
supporting this paper was published and is accessible through the Digital Journal of Global Change Data
Repository at: https://doi.org/10.3974/geodb.2020.06.20.V1.
1 Introduction
As an urgent major public health event, the
COVID-19 pandemic is a severe test of national and local governance
capabilities[1]. When human-to-human spreading was confirmed
on January 20, 2020, China took decisive measures, such
as rapid first-class response on public health emergencies in all localities;
closure of access to Wuhan and other cities; national deployment of medical
staff, supplies and equipment; and implementation of fully or semi-closed
management in all urban and rural communities[2]. With the joint effort of governments,
societies, and residents, the COVID-19 pandemic reached its peak in early February
and subsided at the end of the month in China. Evidently, China achieved a
crucial victory in the fight against the pandemic in this stage[3].
The current focus of prevention and control has shifted to screening and
controlling imported cases from overseas, and the normal prevention and control
in social production and order recovery. The exploration on the cases in China,
which has experienced the entire process from outbreak to control, will contribute
to the global epidemic prevention and control, help deal with the spread of
similar diseases effectively, and improve public health governance ability in
the future[4].
The COVID-19 pandemic has attracted increasing attention from multiple
disciplines[5]. However, several scientific issues have
remained unsolved. In particular, research on the spatio-temporal dynamics of
the pandemic and its formation mechanism from the perspective of geography is
relatively scarce. First, epidemic maps are widely prevalent on social media,
and have even become important social events. However, academic research on epidemics
has seldom involved their spatial
characteristics, and has insufficiently understood and summarized geographical
distance, circle characteristics, and spatial patterns. In particular, these
studies lack a spatio-temporal dynamics perspective. However, these studies
have been indispensable links in the scientific understanding of the spreading
mechanism of pandemics[6-7]. Second, the spatial movement of population is
the main route of epidemic spreading. Numerous studies have focused on the role
of this factor, and believed that human mobility can considerably explain the
spread of pandemics[8?C10]. However, the two patterns of human
mobility, namely, long-term migration and short-term business tour, are generally
confused in the related research, which has only focused on the total
population but disregarded the characteristics of its internal structure. This
mix will lead to biased explanation of epidemic spreading[11-12] and also form misleading social
governance policies and recommendations. In addition, studies on policy
influence have mostly been used to simulate epidemic situations[13-14], while the design and operation
mechanism of specific policies are often excessively simplified. The result is
difficulty in deeply evaluating the multi-level and diversified policy impact,
which is not conducive to the summary of policy experience and optimization of
future policies.
The objectives of this study are as follows: (1) describe the spatial-temporal
dynamics of the spread of COVID-19 pandemic in China by using the daily data of
all provinces (autonomous regions and municipalities directly
under the central government, hereinafter referred to as the Province), (2)
deeply explore the heterogeneous impact of various types of human mobility on
the spread of the pandemic, and (3) analyze the differences and effectiveness
of prevention and control policies issued by different cities in Hubei province
of China.
2 Metadata of the Dataset
The
metadata summary of the dataset[15] is summarized in Table 1. It includes
the dataset full name, short name, authors, data year, data format, data size, data
files, data publisher, and data sharing policy, etc.
Table 1 Metadata summary of the ??Analysis
dataset of COVID-19 spatial and temporal distribution with prevention and
control effect under the population mobility in China (2020.1.19-2.22)??
|
Items
|
Description
|
|
Dataset full name
|
Analysis dataset
of COVID-19 spatial and temporal distribution with prevention and control
effect under the population mobility in China (2020.1.19-2.22)
|
|
Dataset short
name
|
ChinaSpatialTemporalCOVID-19_2020.1.19-2.22
|
|
Authors
|
Liu, T., B-6318-2009,
College of Urban and Environmental Sciences and Center for Urban Future
Research, Peking University, liutao@pku.edu.cn
Jin, Y. A., ABG-5542-2020,
Center for Population and Development Studies, Renmin University of China,
jinyongai0416@ruc.edu.cn
Xiao, W., ABG-5448-2020,
College of Urban and Environmental Sciences, Peking University,
chloexiao@pku.edu.cn
|
|
Geographical region
|
China
|
|
Year
|
2020
|
|
Data format
|
.xls
|
|
|
|
Data size
|
122 KB
|
|
|
|
Data files
|
The dataset in
.xls format is
composed of seven tables of daily COVID-19 data from January 19 to February
22, which
are respectively:
1) Daily new cases of
COVID-19 in each province of China
2) Accumulative cases of
COVID-19 in each province of China
3) Daily incidence rate
of COVID-19 in each province of China
4) Accumulative incidence
rate of COVID-19 in each province of China
5) Average number of days
from the confirmed date to the starting date (Jan 19) in each province of
China
6) Mean
distance of confirmed COVID-19 cases to Wuhan
7) COVID-19 cases in
layers by spatial adjacency with Hubei province
|
|
Foundations
|
National Natural
Science Foundation of China (41801146); COVID-19 Special Fund of Peking
University; Ministry of Education of China (18YJC840022); UKRI??s Global Challenge
Research Fund (ES/P011055/1)
|
|
Data publisher
|
Global Change Research Data Publishing & Repository,
http://www.geodoi.ac.cn
|
|
Address
|
No. 11A, Datun
Road, Chaoyang District, Beijing 100101, China
|
|
Data sharing policy
|
Data from the Global Change Research Data Publishing
&Repository includes metadata, datasets (in the Digital Journal of Global
Change Data Repository), and publications (in the Journal of Global
Change Data & Discovery).
Data sharing policy includes: (1) Data are openly
available and can be free downloaded via the Internet; (2) End users are encouraged
to use Data subject to cita-tion; (3) Users, who are by
definition also value-added service providers, are welcome to redistribute Data
subject to written permission from the GCdataPR Editorial Office and
the issuance of a Data redistribution license; and (4) If Data
are used to compile new datasets, the ??ten per cent principal?? should
be followed such that Data records utilized should not surpass
10% of the new dataset contents, while sources should be clearly noted in
suitable places in the new dataset[16]
|
|
Communication and searchable system
|
DOI, DCI, CSCD,
WDS/ISC, GEOSS, China GEOSS, Crossref
|
3 Methods
3.1 Data Collection
The daily epidemic data used in this study came
from the public data released by the provincial health commissions of all
provinces. The number of newly confirmed cases in some provinces may be
re-reported or missed in the process of data verification. Therefore, this
index was not based on the original data, but it was obtained by subtracting
the accumulative number of confirmed cases published on the day before from
that on the current day. Previous studies have shown that after the peak of the
COVID-19 pandemic in early February, the spatial pattern of the accumulative number
of confirmed cases over the country has been stable. Further calculation has
shown that after February 15, the correlation coefficient
of the accumulative numbers of confirmed cases in all provinces was 1.000.
Therefore, the end of study on the spatial-temporal dynamics of the epidemic
situation was set as the following week (i.e., February 22). At that time, the number of newly
confirmed cases in the majority of provinces of China has been reduced to zero.
The relevant indicators outside the pandemic
were used in this study. The data sources were as follows. The indicator
characterizing population migration refers to the
population residing in Wuhan and other regions of Hubei province whose hukou (household
registration) are registered in other provinces. The related data were from the
distribution of floating population in Wuhan and Hubei province extracted from
the individual database of the national 1% population sampling survey in 2015.
Business tourist flow was characterized by the number of employees in
star-grade hotels and railway passenger volume. The corresponding data were
from the ??China Statistical Yearbook??. Moreover, the national migrants?? dynamic
monitoring survey data in 2017 released by the National Health Commission were
used in this analysis. The survey represented the entire country, provinces,
and major cities, with a sample size of approximately 170,000. The survey data
were the most widely recognized and used by the academic community in the study
on floating population.
3.2 Data Processing
On the bases of the daily accumulative and
newly confirmed cases over the country, the main indicators in this study
included the total number of cases and incidence rate. The meaning of the
number of confirmed cases was based on the overall pressure brought by the
pandemic on the local medical system and social government; this indicator
would have an impact on social emotions and public opinion. Incidence rate was
the ratio of the number of cases to the registered residence population, measured
by the number of cases per million. The reason for selecting registered
population as denominator in this research was that the COVID-19 pandemic coincided with
the Spring Festival, and the majority of the floating population had returned
home. Apart from business travellers of which the number was reduced
drastically by the pandemic, some people settled in different regions would
also return home for family reunion, thereby causing a difference between the
registered and residential population during the Spring Festival and the
epidemic season. However, this difference was substantially less than the scale
of the floating population that returned home. Therefore, the registered
population could better reflect the real population than the permanent population
during the outbreak of the pandemic. The significance of the incidence rate was
that it could not only statistically eliminate the impact of population size in
different regions but also reflect the
probability that people were infected in different regions, thereby presenting
the risk and realistic effects of the pandemic on the people. In addition, the
medical and governance resources in different regions were matched with the
population size. This type of relative indicators can similarly reflect the pressure
faced by the medical and governance systems.
To describe the spatial-temporal
dynamics of the pandemic, this study adopted the weighted average method to
calculate the two indicators. By using the number of daily confirmed cases as
the weight, the daily average distance from the cases around the country to
Wuhan was calculated, thereby reflecting the overall characteristics of the
daily cases close to or far away from Wuhan (i.e., spatio-temporal evolution of
the pandemic). By also using the number of daily confirmed cases as the weight,
the average days from the date of confirmation to the starting date (January
19) of all cases around the country were calculated, thereby reflecting the
overall temporal characteristics of the outbreak of the pandemic throughout the
country (i.e., spatial diffusion process of the outbreak). The calculation formula
is as follows:
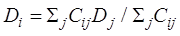 (1)
(1)
 (2)
(2)
where i refers to the date, j refers
to the province, Cij refers to the number of newly confirmed
or accumulative cases in this province on that day, Dj refers to the straight line distance
from the geometric center of province j to Wuhan, Di refers to the average distance from the locations of the newly
confirmed or accumulative cases around the country on day i to
Wuhan, Ni refers to the days from day i to the
starting date, and Nj refers to the average days from the
confirmed dates of all cases to the starting date in province j.
Based on the spatial adjacency characteristics
to Hubei province, provinces were divided into three circles, namely,
first-level adjacency, second-level adjacency, and other provinces, in this
study to calculate the daily changes of the pandemic-related indicators of all
circles. This division reflected the characteristics of the circle structure in
the epidemic spreading. A series of thematic maps and color scale charts of the
epidemic situation change trend in different provinces were drawn to further
investigate the spatial-temporal dynamic process of epidemic spreading at the
provincial level. Based on scatter plot and multi-time point correlation
analysis, the heterogeneous effects of population migration and business tour
on the epidemic situation in different regions and its stage evolution
characteristics were explained.
4 Data Results and Validation
4.1 Data Composition
The analysis dataset of COVID-19 spatial and
temporal distribution with prevention and control effect under the population
mobility in China (2020.1.19?C2.22) includes seven tables of daily COVID-19 data
from January 19 to February 22, namely 1) Daily new cases of COVID-19 in each
province of China, 2) Accumulative cases of COVID-19 in each province of China,
3) Daily incidence rate of COVID-19 in each province of China, 4) Accumulative
incidence rate of COVID-19 in each province of China, 5) Average number of days
from the confirmed date to the starting date (Jan 19) in each province of
China, 6) Mean distance of confirmed COVID-19 cases to Wuhan, and 7) COVID-19
cases in layers by spatial adjacency with Hubei province.
4.2 Data Results and Analysis
4.2.1 Distance and
Circle
Distance is the epitome of spatial association.
The spreading processes of many infectious diseases show adjacent spreading and
distance decay. We calculate daily newly confirmed and accumulative cases,
incidence rate, and the average distance to Wuhan; and analyze circle
differences based on the spatial adjacent relationship between the different
provinces and Wuhan. The results indicated that the transmission distance of
the pandemic and circle dynamics are substantially more complicated than our
expectation.
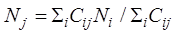
|
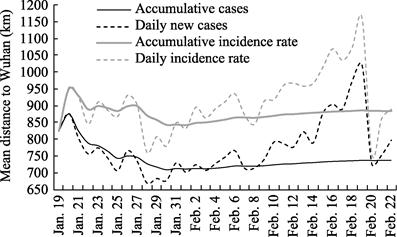
Figure 1 Mean distance from COVID-19-infected
patients to Wuhan city
|
First, the
pandemic pattern (with Wuhan as the center) exhibits a far-to-near process and
near-to-far diffusion thereafter. As shown in Figure 1, the numbers of accumulative
cases and newly confirmed cases and incidence rates indicated a dynamic rule
that the distance from the cases to Wuhan descends initially and ascends
thereafter. The early outbreak mainly occurred in Zhejiang, Guangdong, and
other provinces that are considerably distant from Wuhan but have strong links
with the city??s business tour; and, eventually, in the neighboring provinces
near Wuhan. When the
pandemic lasted 10 days (i.e., since the end of January),
the distance from newly confirmed cases to Wuhan gradually increased, and the
relative distance of the accumulative cases also began to increase thereafter.
Second, the average distance to Wuhan based on
the incidence rate is farther than that based on the number of cases. This
result reflected the fact that the actual spatial distribution of the pandemic
is more balanced than the number of cases. The average distance from the
provinces with weighted incidence rate to Wuhan is constantly higher than the
weighted number of confirmed cases at each stage of the pandemic. In addition,
this difference gradually increases from approximately 100
km to 150 km. This result also completely proved that the serious epidemic
situation in the provinces around Hubei is substantially caused by the high
density and large scale of population in these areas. In the later stage of the pandemic, the
spatial pattern of the pandemic was extremely balanced and has nothing to do
with the distance to Wuhan. Data presented in Figure 1
show that the weighted distance from all provinces to Wuhan, which is
calculated by taking the corresponding incidence rate of newly confirmed cases
as the weight, reaches approximately 1,100 km, which is markedly near the
average geographical distance from all provinces to Wuhan. At this moment, the weighted distance calculated
based on newly confirmed cases remained below 1,000 km.
On the basis of the latter, the conclusion that the distribution of epidemic
situation is close to Wuhan would still be obtained, forming public opinion and
misleading policies.
Lastly, the correlation between spatial
distance and pandemic is not high, and the explanatory power on epidemic
spreading is limited. The correlation coefficient between the number of newly
confirmed and accumulative cases in each province per day and the distance to
Wuhan is generally below 0.6. After excluding the factor that the population
size is generally large in the surrounding provinces, the correlation coefficient
between the newly confirmed and accumulative incidence rates in each province
per day and the distance to Wuhan is constantly below 0.45
which fails to pass the statistical test at the 1% significance level. In addition, the statistical
results of many days cannot pass the test at the 5% significance level. Evidently, distance is not an important factor in the spread of
this pandemic, of which the correlation is relatively weak. From the perspective of circle
differences in the spatial adjacency relationship between each province and
Wuhan, the developmental dynamics of the pandemic in all spatial circles are
synchronous, thereby reflecting the effectiveness and necessity of national
integrated prevention and control. Figure 2 shows that
the newly confirmed cases start to rapidly grow on approximately January 22 in
all circles. In the next 10 days (i.e., end of January and beginning of
February), the epidemic
situation reaches a peak and accumulated stable state. Thereafter, the newly
confirmed cases in different provinces go into a downward range synchronously
and experience approximately two weeks (i.e., around February 20), the newly
confirmed cases in all circles go down to single digits. Only the special
situation that occurred in Rencheng Prison in Shandong province caused the incidental
rise of the sec ond-level neighbouring circle. In general, all circles
experienced a rapid outbreak, rapid growth, and rapid decline, but synchronized
at different stages. The effect of national integrated prevention and control
is reflected from two angles. On the one hand, the period from the outbreak to
the disappearance of the epidemic situation is approximately one month in all
provinces, which is twice the incubation period of the virus. This result
indicated that the epidemic situation has been inhibited effectively and efficiently
after the outbreak, and the continuous transmission of the virus was well contained.
On the other hand, the synchronization of the national epidemic situation
showed that the population exchange scale among regions is not large, and no
large-scale secondary transmission was observed from the area with serious
epidemic situation to the surroundings. Owing to the small difference in the
epidemic situation among different regions, the interregional secondary
transmission was avoided successfully, even if human mobility was not completely
cut off.
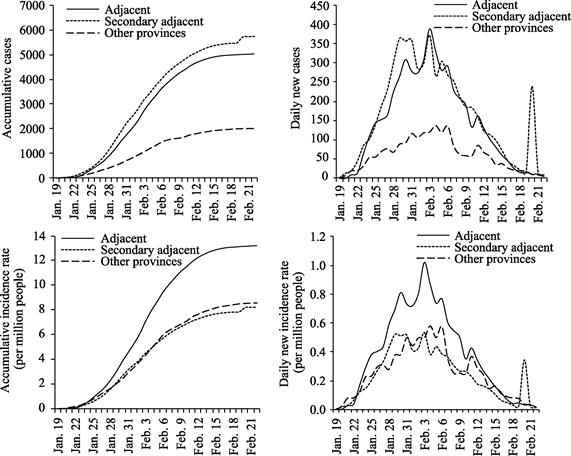
Figure 2 Comparison of the epidemic situations in three
circles
The incidence
rate in the province adjacent to Hubei is approximately 1.6 times that in other
regions. Moreover, no difference was observed between the secondary adjacent
provinces and other provinces. Among the three circles divided on the basis of
the adjacent relations of Hubei with other provinces, the number of the
confirmed cases in Anhui, Henan, Jiangxi, Hunan, Chongqing, and Shaanxi, which
are primary adjacent to Hubei, approximated that in 12 provinces and districts
that are secondary adjacent to Hubei (Table 2). On
February 22 (i.e., end of the pandemic), 5,028 and 5,751
patients were accumulatively diagnosed respectively in the two circles. On
February 3 (i.e., peak of the epidemic situation), 389 and 373 patients were
diagnosed in the two circles, which were considerably close as well. However,
the total population in the six provinces that are primary adjacent to Hubei is only 381
million, whereas that in the 12 provinces that are secondary adjacent to Hubei
is approximately 697 million. Therefore, the similar number of confirmed cases
does not reflect the similar severity of the epidemic situation in the two
circles. Instead, the overall situation in the secondary adjacent provinces is
considerably better than that in the primary adjacent provinces. After the
impact of population size was excluded, the accumulative incidence rate in the
secondary adjacent circle was approximately 8.3 per million people, which is
substantially below that in the first adjacent circle (i.e., 13.2 persons per
million people) and also slightly lower than the average level in other
provinces (i.e., 8.6 per million people). The peak of the daily new incidence
rate also shows a similar pattern. The peak values in the three circles are
1.02, 0.53, and 0.58 persons per million people.
Table 2 Comparison of the overall characteristics
of the epidemic situations in three circles
|
|
Registered population
(100 million)
|
Accumulative confirmed
cases (Feb. 22)
|
Peak of newly confirmed
cases
|
|
Number
|
Incidence
rate
(per
million)
|
Peak
date
|
Number
|
Incidence
rate (per million)
|
|
Primary
adjacent
|
3.81
|
5,028
|
13.20
|
Feb. 3
|
389
|
1.02
|
|
Secondary
adjacent
|
6.97
|
5,751
|
8.25
|
Feb. 3
|
373
|
0.53
|
|
Other
provinces
|
2.56
|
1,997
|
8.58
|
Feb. 4
|
138
|
0.58
|
4.2.2 Dynamics of
the Provincial Pattern
COVID-19
shows different spatial patterns in four stages, namely, outbreak, development,
peak, and subsiding. In general, the pattern is not a core-peripheral one but
much more complex than that. It reflects the multiple factors underlying the
epidemic spreading. At the outbreak stage, the impact of leapfrogging spreading
on epidemic hot spots is higher than that of adjacent spreading. From the
epidemic pattern map on January 25 (Figure 3), the first-batch outbreak sites
outside Hubei province include Zhejiang, Guangdong, Hainan, Beijing, and
Shanghai. Zhejiang is the first province with confirmed cases exceeding 100 and
the number of confirmed cases in Guangdong also reached 98. The initial
incidence rate in these areas was substantially higher than that in the
provinces around Hubei province. Only in Chongqing did the outbreak comes
early. The common characteristics in the sites where the pandemic outbreaks in
the early stage are that these sites are economically devel oped, with the
national-level super large central cities or hot places for travelling, and
they all have close business tour links with Hubei and Wuhan.
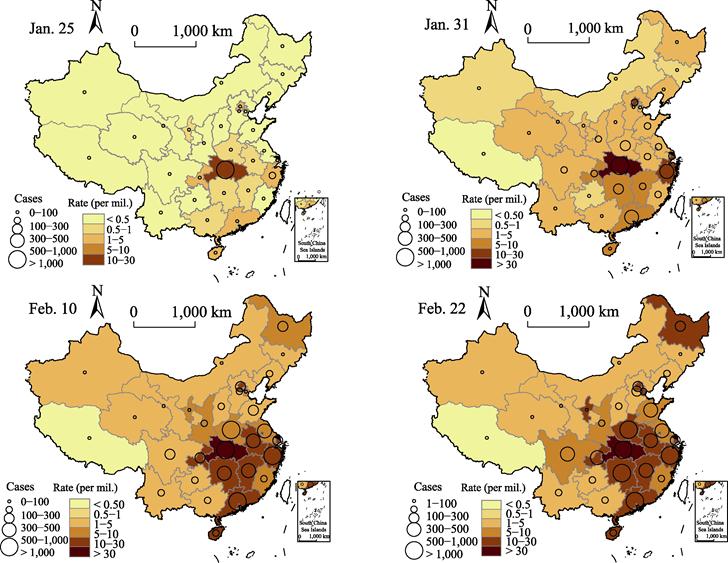
Figure 3 Spatial distribution of cases and rate of
the COVID-19 pandemic in China from Jan. 25, 2020 to Feb. 22, 2020
At the second stage in the epidemic development, hot spots with
leapfrogging spreading are continuously enhanced, while the effect of adjacent
spreading begins to appear. By the end of January, Beijing,
Shanghai, Zhejiang, and Guangdong continue to experience the most serious
pandemic, as the accumulative incidence rates in Beijing, Shanghai, and
Zhejiang are at over 10 persons per million people, and the number of confirmed
cases in Zhejiang and Guangdong exceeds 500. All of these breakthroughs occur in hot spots with leapfrogging spreading. Moreover, the
epidemic situation in the provinces and cities around Hubei province developed
rapidly. In Hunan, Jiangxi, and Chongqing, the accumulative incidence
rates were over 5 persons per million people, and the
confirmed cases in Henan and Hunan were 422
and 389, respectively, second only to Zhejiang and Guangdong. The hot circle is initially formed around Hubei province.
However, the characteristics of this type of circle are not typical. On the one hand, the epidemic situation in
Anhui and Shaanxi adjacent to Hubei
was not more serious than that in other provinces. On the other hand, the
epidemic situation developed rapidly
in Shandong, Jiangsu, Fujian, and Sichuan not adjacent to Hubei.
At the third stage when the pandemic is at the peak, two dominant modes,
namely, leapfrogging and adjacent spreading, show a balanced state. After the
peak period in the early February, the epidemic situation in the provinces
around Hubei was completely shown, while the epidemic situation in leapfrogging
hot spots formed in the beginning remained outstanding. From the accumulatively
confirmed cases, Guangdong, Zhejiang, and Henan became the top three provinces
with confirmed cases over 1,000, followed by Hunan,
Anhui, and Jiangxi around Hubei province, with confirmed cases of over 800.
From the incidence rate per million people, the top three provinces over 20
remained Beijing, Shanghai, and Zhejiang, and the incidence rates in Guangdong
and Hainan also exceeded 10. At this time, the incidence rates in Jiangxi,
Chongqing, Hunan, and Anhui around Hubei also remained over 10 persons per million
people. Evidently, the hot adjacent circle was formed.
In the fourth stage when the pandemic is gradually subsiding, the final
epidemic pattern has four typical characteristics. First, the areas with the
most serious epidemic owing to leapfrogging spreading include Beijing, Tianjin,
Shanghai, Zhejiang, Guangdong, and Hainan. Second, the
epidemic situation in the provinces around Hubei province was generally
serious, and the majority of them have large population and numerous infected
people, forming an adjacent circle with high incidence of epidemic. Among them, the accumulative number
of confirmed cases in Henan, Hunan, Anhui, and Jiangxi, which have large population,
has reached or has been close to 1,000, ranking in the top six. Chongqing??s
population base is relatively small, but there were 573
confirmed cases, ranking ninth. The incidence rates per million people in the
five provinces and cities were over 10. Third, the epidemic situation in Shandong,
Jiangsu, Sichuan, and other provinces with large population is also worthy of
attention. The incidence rates in these provinces were in the middle level, but
the confirmed cases were over 500 owing to their large population, ranking in
the top 10. Fourth, Heilongjiang is a unique province with incidence rate in
the top 10, excluding the first two types of hot spots. Early signs showed
careless omission in its border control. Since the outbreak of the pandemic,
the incidence rate has been increasing continuously, and entered the top 10 in
the first half of February. Owing to Heilongjiang??s remote location, small
population base, and slow release of epidemic information from neighboring
Russia, the severity of the epidemic situation in this province did not attract
sufficient attention for a long time, resulting in serious consequences.
Based on the average days from the confirmed date of all cases in
different provinces to the starting day, the
corresponding average diagnosed days in different provinces were obtained. The
overall characteristics of the development of epidemic situation in various regions
and the regularity of the change in the epidemic situation in China can be
found. The results in Figure 4 show the following characteristics. First, the development of the epidemic in various
regions was highly synchronous, and the average diagnosed time of cases in
nearly all provinces was in the first 10 days of February, particularly in the
third to the fifth days. It coincides with the law of circle division shown in
Figure 2. That is, the
synchronization law is not only reflected among the
circles but also occurs in the majority of provinces, thereby reflecting the
national integrated prevention and control strategy and its effectiveness. Second, the average diagnosed time
in the provinces adjacent to Hubei province was highly consistent. Only in
Hunan province, which has the closest contact with Hubei province and the
strictest prevention and control measures, and Shaanxi province where the
epidemic situation was consistently not severe, the average diagnosed time was
one day earlier than the other four provinces and cities. Third, no circle
characteristic was evident in the secondary adjacent and other provinces, but
the interprovincial differences are evident.
|
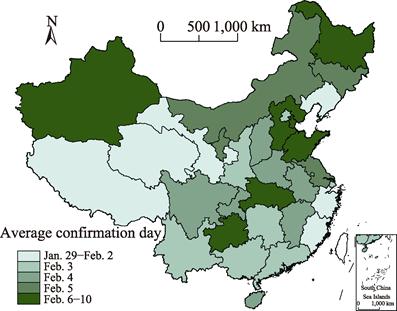
Figure
4 Average diagnosed date of confirmed
cases in provinces of China
|
5 Impacts of
Human Mobility on the Spatial Dynamics of the Pandemic
Similar to most infectious diseases, the main
route of rapid spreading of COVID-19 is people-to-people transmission.
Personnel exchange between the epidemic center and all regions is the key
factor of epidemic situation. Note that mobility has numerous forms, including
long-term migrant workers and businessmen, as well as short-term business,
tourism, family visits. The mobility behavior of various groups has different
impact on the spread of the epidemic, which needs to be investigated
separately.
5.1 Migrants in Hubei Province
The
outbreak of COVID-19 happened during the Spring Festival. Long-term migrant workers
returning home for the Spring Festival may be an important means for the spread
of the epidemic. Figure 5 shows the relationship between the number of registered
population in each province migrating to Wuhan and other cities of Hubei and
the accumulative cases in the province. First, the long-term connections of
various provinces to Wuhan and other cities of Hubei in the population have
strong explanatory power for the epidemic situation. Evidently, exclusively focusing on Wuhan will
be insufficient to explain the impact of population returning to their hometown
on the spread of the epidemic. Second, the preference of population migration
for spatial proximity is the main formation mechanism of spatial distribution
pattern of epidemic situation. On the one hand, provinces around Hubei are the
major sources of migrants in Wuhan and Hubei provinces. The close population
connection leads to the most serious epidemic situation in the adjacent circle.
On the other hand, the epidemic situation was considerably minor in Jilin, Ningxia,
Inner Mongolia, Tibet, and Qinghai. Guangdong and Zhejiang are the two provinces
with the most serious deviation from the fitting line. That is, the explanatory
power of the total migrants remained insufficient, and the influence of the
internal structure of migrants or short-term mobility cannot be disregarded.
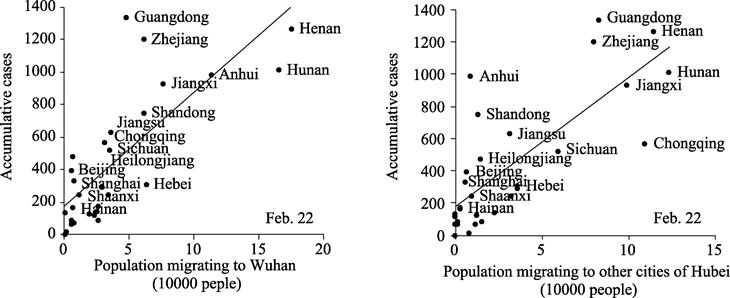
Figure 5
Relationship between the migrating population in provinces to Wuhan and
other cities of Hubei and the number of COVID-19 confirmed cases
|
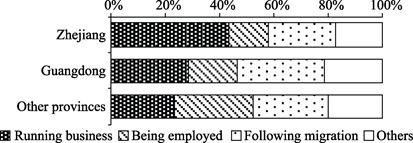
Figure
6 Reasons for registered population in
various provinces migrating to Hubei
|
5.2 Business People
Residing in Hubei Province
The registered population in Guangdong and
Zhejiang who have resided in Wuhan or other cities in Hubei is less than that
in Hunan, Jiangxi, Anhui, and other provinces around Hubei province, although
the epidemic situation is more serious than that in the latter. This
dislocation urged us to further examine the causes of population migration and
mobility. Accordingly, the majority of the people from Wenzhou, Taizhou, and
other places of Zhejiang are in business, and minimal workers are employed. The
evidence is found from the data from migrant dynamic monitoring survey in China
released by the National Health Commission (Figure 6). Among the Zhejiang people floating
to Hubei, 57.4% are in business and 22.9% are workers engaged in the industrial work. The
corresponding ratio is 2.51. However, the ratio for all migrants in Hubei is
only 0.84. It is 1.60 for those from Guangdong, which is twice that from other
places to Hubei. Migrant workers and businessmen are both long-term migrants of
Hubei. However, compared with migrant workers, businessmen have higher impact on the spread of
the epidemic, even though their absolute scale is small. On the one hand, businessmen
are likely to have extensive contact with the local people in the outbreak
area, and the probability of being infected is extremely high. On the other
hand, businessmen have strong local mobility after returning to their
hometowns, with numerous visits to relatives and friends in a wide range.
Therefore, their infectivity is substantially higher than that of migrant
workers. Based on the analysis on the long-term migrants in Hubei province, we
can provide an effective explanation on the spreading mechanism of COVID-19 in
Guangdong and Zhejiang, where the population scale migrating to Hubei is not
high but the outbreak of epidemic situation is the earliest and most serious.
5.3 Short-term Business Travelers
Short-term intercity business tour is also a
factor that cannot be disregarded. The number of employees in star hotels and
railway passenger volume are used to characterize the intensity of population
flow for business and tourism, and to investigate its relation with the number
of confirmed cases. Similarly, a significant linear correlation was found. The
correlation coefficients are 0.45 and 0.60, respectively.
It is extremely close to the influence degree of long-term migration (Figure 7).
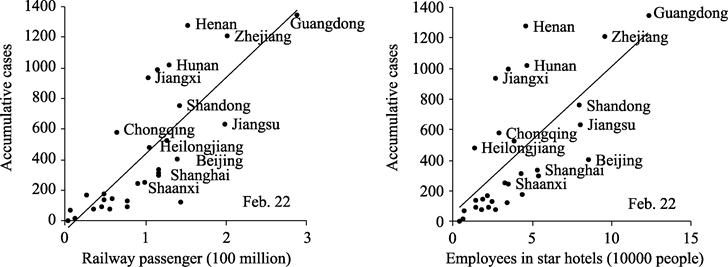
Figure 7 Relationship between the number of railway
passenger and employees in star hotels, and number of COVID-19 confirmed cases
|
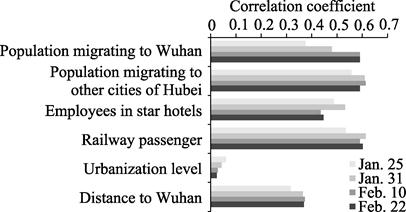
Figure
8 Changes
in the correlation between population-related indicators and epidemic
situation
|
Therefore,
people in outbreak areas going to other areas of the country for business and
tourism should be another factor leading to the spread of the virus. Evidently,
Guangdong is the most typical. Although the scale of floating population from
Guangdong to Wuhan and Hubei province is not prominent, and the proportion of
long-term businessmen in Hubei province is lower than that in Zhejiang province,
the number of COVID-19 confirmed cases is extremely high. Its position as a
business and tourism center plays a significant role in the spread of the
epidemic. This case is a typical case of short-term population mobility driving
the spread of the epidemic.
5.4 Stages of the Impact
of Various Types of Population Mobility on the Epidemic
The
relationship between the long- or short-term population mobilities and the
spread of the epidemic is stable and dynamic (Figure 8). First, long- and short-term
population mobilities have similar explanatory power to the spread of the
epidemic. The correlation coefficients between the two groups of indicators and
accumulative number of confirmed cases in different regions are extremely
close. Thus, we should not disregard them in the analysis of the epidemic
spreading mechanism. Second, the explanatory power of the population connections
in different regions with Wuhan continues to increase, but the influence of
population connections with other cities and prefectures in Hubei remains
stable. The overall explanatory power of the latter is even stronger than that
of the former. It can be seen that the spread of the epidemic in Hubei province
was hardly under effective control in the early stage. However, long-term migrant workers
and businessmen returning from Wuhan experienced a relatively long incubation
period, which may be related to the severity of the epidemic situation in
Wuhan. In addition, the explanatory power of the distance to Wuhan to the
distribution pattern of the epidemic situation is constantly lower than that of
various population mobility indicators. Evidently, the important aspect behind
spatial distance is the personnel exchange between regions. Lastly, the impact
of urbanization level on the number of confirmed cases in various regions is
markedly small and constantly decreasing, thereby reflecting that the
localization spreading of the virus has been effectively controlled through out
the country. Moreover, there is no situation that the denser the living form of
population, the more serious the epidemic situation.
6 Policy Analysis: Using Cities in Hubei as Examples
The effective management
and control of inter- and within-city population mobilities was the key reason
for the rapid control of COVID-19 pandemic in China. However, the strength and
effectiveness of the control still have local differences. We combed and
analyzed the population mobility control policies in Wuhan and other cities and
prefectures of Hubei. On the one hand, the result can explain the relationship
between the prevention and control measures in these areas with serious
pandemic and local epidemic situations. On the other hand, it can also further
explain the spatial-temporal dynamics of the national epidemic situation caused
by the aforementioned population mobility from Hubei to other provinces and cities.
6.1 Prevention and Control Policies and
Dynamics of the Epidemic Situation in Wuhan
By combing the related major events based on
the time line, we can summarize the key time points in the control process of
the pandemic and the change of control strategies in Wuhan. Compared with the
curves of Wuhan??s epidemic situation, we can further evaluate the prevention
and control, which can provide reference to cope with public health events.
The first critical period of the policy was on January 20 to 23, when
China faced up to the pandemic with a scientific attitude and immediately
formed a high consensus on the comprehensive anti-epidemic with the Wuhan
lockdown as the key node. Before January 19, people had few sense of
self-protection. On January 20, Mr. Zhong, N. S., an academician, said that
COVID-19 had certain human-to-human spreading, and the community started to
become alert. On this day, Chairman Xi, J. P. made
an important instruction to prioritize the people??s safety and health,
formulate an effective program, and organized all sides to take prevention and
control measures to resolutely curb the spread of the pandemic. In No.1 official document released
by the National Health Commission in 2020, the pneumonia caused by COVID-19 was
included in Class B infectious diseases, stipulated in the Law of the
People??s Republic of China on the Prevention and Treatment of Infectious Diseases.
The prevention and control measures for Class A infectious diseases were taken.
Since then, the number of newly confirmed cases have been summarized and
released daily. Moreover, COVID-19 prevention and control headquarters were
established in Wuhan. On January 23, airports, railway
stations, and other channels were closed, and Wuhan was placed on lockdown. The
spread of the epidemic was controlled with unprecedented powerful means. On the
same day, Wuhan made a decision to build Huoshenshan Hospital. Moreover,
political decision-making at the highest level, scientific judgments of top
medical experts, and the information disclosure attitude of competent
departments have achieved key effect. That is, governments at all levels and
people from all walks of life immediately reached a consensus on comprehensive
anti-epidemic actions. Hence, the cohesion of national consensus is crucial for
epidemic prevention and control.
The core work in the second stage is to establish a scientific and
effective epidemic prevention and control system, which took approximately two
weeks, from January 24 to February 6. After a comprehensive anti-epidemic
consensus was reached, Wuhan also became the focal point of the central and
local governments?? response strategies, and various anti-epidemic measures were
frequent. Therefore, these seemingly chaotic strategies essentially focused on
three major tasks for the prevention and control of the epidemic: collecting
and isolating patients, cutting off the spreading routes, and protecting
susceptible people. Consequently, a scientific and effective prevention and
control system was gradually established. Based on Huoshenshan Hospital, the
Wuhan government decided to build Leishenshan Hospital on January 25. The two
hospitals were officially opened on February 4 and 8
respectively. On January 24, the first batch of military and
provincial/municipal medical teams went to Wuhan, and some provinces
successively provided support to ensure the admission and treatment ability in
Wuhan. On February 2, Hubei announced that all suspected cases were
centralized, and forced those cases that refused to be isolated. On February 3,
Cabin Hospital was established in Wuhan for patients with mild symptoms, and
started operations two days later. In terms of cutting off the spreading routes, all
types of passenger traffic in Wuhan were suspended on January 23. On
January 26, automotive vehicles were prohibited in the central districts. On February 2,
troops stationed in Hubei began to distribute and supply living materials for
Wuhan citizens. In terms of protecting susceptible people, 132
isolation facilities were established in Wuhan on February 4. Since
February 6, the body temperature monitoring has been carried out in Wuhan. Thanks to the trust and support of
the entire society, medical and construction teams from all over the country
fought side by side with Wuhan citizens, making all measures to be effectively
implemented.
The policies at the third stage focus on the improvement of prevention
and control measures, and the stabilization of social order, which lasted for
approximately two weeks until February 19. On the one hand, we should strictly
implement and constantly improve the prevention and control system in the form
of a protracted war. On February 7, the National Health Commission announced a
new rescue model. A total of 16 provinces were asked to
provide support in the form of one province-to-one city. The unified scheduling
was changed to counterpart assistance, giving full play to the enthusiasm and
creativity of local governments. By February 10, 19 provinces have provided
one-to-one support. On
February 11, all residential districts of the city were
under the closure management, which was extended thereafter to all urban and
rural communities on February 16. On February 17, strict management measures
for closing public places were formulated. On the other hand, social concerns
were actively responded and social emotions and order were stabilized. On February
7, the death of Li, W. L. was identified as an occupational injury. The State
Committee of Supervisory went to Wuhan to conduct a comprehensive
investigation. On February 8 and 13, the main leaders of Hubei province and
Wuhan were re-arranged. The epidemic situation should be further investigated,
hospitals must be constructed, the number of beds should be increased. In the middle of February, a phenomenon
that the beds in hospitals were waiting for patients has been achieved, thereby
indicating that the epidemic prevention and control has won the spread of the
epidemic.
The fourth stage started from late February. The policy was improved and
the epidemic situation was stabilized. Social order was restored in early
March. On March 8, newly confirmed and suspected cases
in Hubei, excluding Wuhan, were cleared to zero. After 10 days, the newly
confirmed cases in the entire province were cleared for the first time, and the
cases appeared rarely. On March 11, Hubei started to implement differentiated
prevention and control in different areas at varying levels, and enterprises
resumed work and production conditionally based on the categories of
enterprises and time. On
March 17, medical teams from different provinces began
to evacuate from Hubei. On March 25, the control measures for the passageways,
excluding Wuhan, were relieved. On April 8, the control measures for the passageways of
Wuhan were relieved. On April 26, Wuhan??s COVID-19
patients staying in hospital were cleared to zero. In middle and late May, 9.9
million people in Wuhan received nucleic acid testing, and no confirmed case
was found.
|
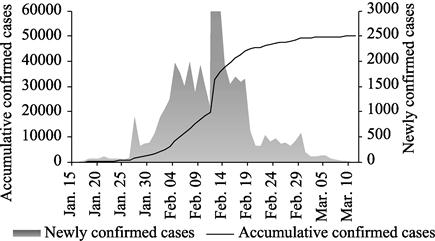
Figure 9 Dynamic curves of the
epidemic situation
in Wuhan from Jan.15, 2020 to Mar.10, 2020
|
The COVID-19 cases curve in Wuhan considerably
reflects the changes of the aforementioned prevention and control polices, and
directly shows the mistakes and results of the epidemic prevention and control (Figure 9). The early avoidance and concealment of the
COVID-19 pandemic leads to two important consequences, making the later
epidemic prevention and control policy must be systematic and strict. First, a
large-scale infected population has been formed. The early concealment has
gradually emerged in the late stage. It poses a great and continuous pressure
on the medical system. Second, in case of insufficient preparation, the medical
treatment system is in disorder and the social policy lacks trust foundation.
Third, the extension of the epidemic spreading chain was controlled owing to
the constant improvement and persistence after the establishment of the
prevention and control systems. The infection is limited to family infection
within the incubation period, and there is no social aggregation infection and
the second peak of the epidemic situation. Lastly, a good interaction between
the society and medical system is critical. Social trust can be rebuilt
rapidly, which ensures social stability and universal support from all people.
The medical and infectious disease prevention and control systems have also
given a rapid response, and both of them support each other and guarantee each
other. This aspect may be the key to the success of epidemic prevention and control
in Wuhan and even the entire country.
6.2 Coping Strategies and
Epidemic Situation among Cities in Hubei Province
The control effects of various cities in Hubei
province are evidently different. The time when measures are taken at the
municipal level, strength and intensity for implementing measures and the
follow-up policies adapted to local conditions are the key factors to explain
the differences in the effectiveness of epidemic prevention and control.
|
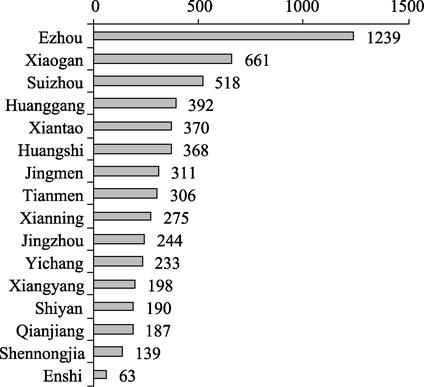
Figure 10 Incidence rates of
COVID-19 in cities in Hubei province, excluding Wuhan (per
million people)
|
As of April 26, the
number of patients staying in hospitals in Wuhan has been cleared to zero. The
proportion of
accumulatively confirmed cases in cities and prefectures in Hubei to the
registered population, also called incidence rate, is shown in Figure 10. The incidence rate of Wuhan is 53.5 persons per 10,000 people,
ranking first, followed by Ezhou, with 12.4 persons infected per 10,000 people.
Xiaogan city is the third.
Ezhou and Xiaogan are close to Wuhan. The last three cities are Qianjiang, Shennongjia
district, and Enshi prefecture. Shennongjia district is located in the deep
mountains, sparsely populated, and it is reasonable that the infection rate is
low. However, Qianjiang, as a densely populated city with convenient transportation,
and only 150 km to Wuhan, ranks last but second in incidence
rate. It is difficult to explain with some indicators, such as human mobility
and economic exchanges with Wuhan. Enshi prefecture is distant from Wuhan and is mainly mountainous.
However, it is one of six prefecture-level cities with population of over 4
million. Approximately 100,000 migrant workers in Wuhan are from Enshi. The
difference in the prevention and control measures may be one of the important
reasons for the varying incidence rates.
The strong and powerful control of the epidemic
situation in Hubei started from the city closure, which was widely implemented
in all areas of the province. However, the implementation time varied. As early
as January 17, Qianjiang was closed and people were grounded and required to be
isolated at home. Meanwhile, patients were immediately admitted and
quarantined. Owing to these immediate and powerful measures, the result of epidemic
prevention and control in Qianjiang is remarkable. Therefore, Qianjiang is the
city around Wuhan with the lowest incidence rate, and also one of the cities
with the mildest epidemics in the province.
The infection and mortality rates in Enshi prefecture were extremely
low, in the forefront of the province. There were a total of 4.01 million
registered population in the entire prefecture (based on 2017 statistics). Only 252 cases confirmed and 7 deaths during
COVID-19 pandemic. It also considerably benefitted from high alertness and powerful
treatment and prevention and control measures. A field investigation by the authors
indicated that the
management and control of human mobility and epidemic situation at the level of
urban and rural community was strict and effective. Particularly in rural
areas, the publicity, investigation, and access control measures with a village
as the unit have been strictly implemented. Enshi prefecture attaches
considerable importance to the dynamic adjustment of epidemic prevention and
control policies and the formulation and implementation of supporting policies.
For example, while carrying out full-close management in all villages, the town
government uniformly distributes living materials, from registration for buying
anti-cold drugs to selling anti-cold drugs for cough and fever all over the
prefecture.
7 Discussion and Conclusion
Based
on the daily epidemic data of China, this study describes the spatial-temporal
dynamics of COVID-19 pandemic in China, examines the heterogeneity impact of human
mobility patterns on the spread of the epidemic, and analyzes the differences
and effectiveness of epidemic prevention and control policies by taking different
cities and prefectures in Hubei province as examples. The research results are as follows. (1) The spatial dynamics of the pandemic is not the core peripheral
structure dominated by adjacent spread, but the result of multiple spatial
patterns being mixed, thereby reflecting the multiple factors and motive force
of epidemic spread.
Leapfrogging spreading is dominant in the outbreak stage of the pandemic, and
adjacent spreading is dominant later. Their combination promotes the pandemic
to reach the peak, and three types of pandemic hot spots, such as Beijing,
Tianjin, Shanghai, Zhejiang, Guangdong and other highly developed areas, surrounding
provinces, and populous provinces, are eventually formed. In addition, there
have been signs of pandemic import early in the northeast border areas. (2) The
association between spatial distance with
the epidemic situation is not high. The epidemic pattern is mainly
affected by human mobility. The homecoming of long-term migrant workers and
businessmen and the short-term business tour flow have heterogeneous effects on
the development of pandemic in different regions and different stages. Only by
combining the structural analysis of population with the spatial-temporal
dynamic analysis of epidemic situation can we effectively explain the spread
mechanism and control effect of the pandemic. (3) The
analysis on the differences in the prevention and control policies and the epidemic
situation among cities and prefectures in Hubei province shows that the
timeliness, scientificity, systematicness, and sustainability of epidemic
prevention policies are indispensable; and social stability supported by trust
and national participation are also indispensable. The key to the success of epidemic prevention
and control lies in the positive interaction between health care and social
governance system.
The preceding
conclusion also present points to ponder. First, there is an essential difference
between simple and intuitive epidemic map and rigorous and in-depth spatial and
temporal dynamic analysis. The latter requires the professional analysis of
geographers, who can find and summarize the characteristics and laws of
epidemic spread, and have a direct and profound understanding of the epidemic
spreading mechanism, thereby reflecting the discipline advantages of
geographical spatial analysis.
Second, human mobility driving the spread of virus is the basic route
for the spread of the epidemic. Scientific research will not remain in this
simple correlation. Only by deeply analyzing the structural characteristics of
human mobility can we truly understand the mechanism of epidemic spread and
explain the temporal and spatial dynamics of epidemic situation. It is
particularly important to distinguish between long-term permanent migration and
short-term daily business tour flow. The former can affect the spread of the
pandemic only at the specific time point of homecoming during the Spring
Festival, and poses a serious impact in the main inflow and outflow places.
However, the latter may pose an impact in any time and place. Accordingly,
migrant workers and businessmen should not be the focus of epidemic prevention
and control, and they should not be excluded by the institution or society. The
daily business tour flow is the key group of concern in the development of
public health emergency response system.
Lastly, this study analyzes the spatial-temporal dynamics of epidemic
situation by using big data, and makes an effective explanation by using
statistical data and survey data, which can be regarded as an attempt to
combine big data with traditional data. The authors?? related research also
reveals that the interpretation of Baidu migration and other data on the dynamics
of epidemic situation is not better than that of the traditional data.
Relatively, the former has higher timeliness, which is conducive to the
analysis on temporal and spatial dynamics; the latter with more rich indicators
can support the structural analysis of human mobility, and explain the dynamic
of epidemic situation more deeply[17]. The cases for epidemic analysis
completely show no difference between big data and traditional data in advantages
and disadvantages, and also no mutual exclusion. The deep integration and complementary
advantages of both are important for the study of social science.
Author Contributions
Liu, T., and Jin, Y. A. designed the algorithms of
dataset. Xiao, W., Chen, J. C., and Liu, T. contributed to the data processing
and analysis. Liu, T., Chen, J. C., and Jin, Y. A. wrote the data paper.
References
[1]
Chen, S. M., Yang, J. T., Yang, W. Z., et al.
COVID-19 control in China during mass population movements at New Year [J]. The
Lancet, 2020, 395(10226): 764-766.
https://doi.org/10.1016/S0140-6736(20)30421-9.
[2]
Yang, M., Xie, Z. Y. Impacts of
fighting COVID-19 on China??s population flows: an empirical study based on
baidu migration big data [J]. Population Research, 2020, 44(4): 74-88.
[3]
Shi, Q. J., Liu, T. Should internal migrants be held
accountable for spreading COVID-19? [J]. Environment and Planning A: Economy and Space, 2020,
52(4): 695-697.
https://doi.org/10.1177/0308518X20916764.
[4]
Ouyang, T. H., Zheng, S. W.,
Cheng, Y. The construction of a governance system for large-scale public health
emergency: a case study based on the Chinese scenario [J]. Management World, 2020, 36(8): 19-32.
[5]
Sirkeci, I., Yucesahin, M. M. Coronavirus and
migration: analysis of human mobility and the spread of Covid-19 [J]. Migration
Letters, 2020, 17(2): 379-398.
https://doi.org/10.33182/ml.v17i2.935.
[6]
Wang, J. E., Du, D. L., Wei,
Y., et al. The development of COVID-19 in China: spatial diffusion and
geographical pattern [J]. Geographical Research, 2020, 39(7): 1450-1462.
[7]
Zhou, C. H., Su, F. Z., Pei, T., et al.
COVID-19: challenges to GIS with big data [J]. Geography and Sustainability, 2020, 1(1): 77-87.
https://doi.org/10.1016/j.geosus.2020.03.005.
[8]
Qiu, Y., Chen, X., Shi, W. Impacts of social and
economic factors on the transmission of coronavirus disease 2019 (COVID-19) in
China [J]. Journal of Population Economics, 2020, 33(4): 1127-1172.
https://doi.org/10.1007/s00148-020-00778-2.
[9]
Liu, Y., Yang, D. Y., Dong, G.
P., et al. The spatio-temporal spread characteristics of 2019 novel
coronavirus pneumonia and risk assessment based on population movement in Henan
province: analysis of 1243 individual case reports [J]. Economic Geography, 2020, 40(3): 24-32.
[10]
Jia, J. S., Lu, X., Yuan, Y., et al.
Population flow drives spatio-temporal distribution of COVID-19 in China [J]. Nature, 2020, 582(7812): 389-394.
https://doi.org/10.1038/s41586-020-2284-y.
[11]
Shi, Q. J., Dorling, D., Cao, G. Z., et al.
Changes in population movement make COVID-19 spread differently from SARS [J]. Social
Science & Medicine,
2020, 255: 113036. https://doi.org/10.1016/j. socscimed.2020.113036.
[12]
Dowd, J. B., Andriano, L., Brazel, D. M., et al.
Demographic science aids in understanding the spread and fatality rates of
COVID-19 [J]. Proceedings of the National Academy of Sciences, 2020, 117(18): 9696.
https://doi.org/10.1073/pnas.2004911117.
[13]
Fang, H. M., Wang, L., Yang, Y. Human mobility
restrictions and the spread of the novel coronavirus (2019-nCoV) in China [J]. National
Bureau of Economic Research Working Paper Series, 2020, No. 26906.
https://www.nber.org/papers/w26906.
[14]
Yang, Z. F., Zeng, Z. Q., Wang, K., et al. Modified
SEIR and AI prediction of the epidemics trend of COVID-19 in China under public
health interventions [J]. Journal of Thoracic Disease, 2020, 12(3): 165-174. https://dx.doi.org/
10.21037%2Fjtd.2020.02.64.
[15]
Liu, T., Jin, Y. A., Xiao, W.
Analysis dataset of COVID-19 spatial and temporal distribution with prevention
and control effect under the population mobility in China (2020.1.19-2.22) [J/DB/OL]. Digital
Journal of Global Change Data Repository, 2020.
https://doi.org/10.3974/geodb.2020.06.20.V1.
[16]
GCdataPR Editorial Office.
GCdataPR data sharing policy [OL]. https://doi.org/10.3974/dp.policy.2014.05 (Updated
2017).
[17]
Liu, T., Jin, Y. A. Human
mobility and spatio-temporal dynamics of COVID-19 in China: comparing survey
data and big data [J]. Population Research, 2020, 44(5): 34-49.