Dataset of Extreme High Temperature Weather
in Shanghai
Jiang, R.
Shanghai HuaMin Environmental Science and Technology Development Company, Shanghai 200062, China
Abstract: Extreme high temperature data in Shanghai was characterized based on several data sources. Meteorological data from Shanghai Xuhui Station for 1960-2013, including daily maximum temperature, daily minimum temperature, and relative humidity, from the “Daily data from surface meteorological stations in China” (China Meteorological Data Service Center) and daily maximum and minimum temperature in Shanghai from 2004 to 2014 from the meteorological statistics of Shanghai Meteorological Bureau were analyzed. The dataset is comprised of eight statistical tables: (1) meteorological parameter data related to high temperature in Shanghai for 1960-2013; (2) characteristic high temperature analysis data for Shanghai for 1960-2013; (3) annual maximum temperatures in various districts of Shanghai from 2004 to 2014; (4) annual hot days for various districts of Shanghai from 2004 to 2014; (5) annual tropical nights in various districts of Shanghai from 2004 to 2014; (6) the times of annual heat waves in various districts of Shanghai from 2004 to 2014; (7) the days of annual heat wave in various districts of Shanghai from 2004 to 2014; and (8) annual heat wave intensity in various districts of Shanghai from 2004 to 2014. The dataset is formatted in excel files with a data volume of 27.4 KB.
Keywords: Shanghai; weather; extreme high temperature
1 Introduction
Dataset of extreme high temperature weather in Shanghai (ExtrHighTemShanghai for short)[1] is produced based on meteorological data collected at Shanghai Xuhui Station for 1960-2013, including daily maximum temperature, daily minimum temperature, and relative humidity, from the “Daily data from surface meteorological stations in China” (China Meteorological Data Service center) and daily maximum and minimum temperature in Shanghai from 2004 to 2014 from the meteorological statistics provided by the Shanghai Meteorological Bureau. The extreme high temperature weather dataset for Shanghai was obtained by analyzing extreme high temperature weather indices in Shanghai and various districts, including the daily highest temperature, daily lowest temperature, hot days, tropical nights, heat wave times, heat wave days, heat wave intensity.
2 Metadata of Dataset
The metadata for the extreme high temperature in the Shanghai dataset[1] is summarized in Table 1. It includes the dataset full name, short name, authors, year of the dataset, temporal resolution, data format, data size, data files, data publisher, and data sharing policy.
Table 1 Metadata summary of the extreme high temperature in Shanghai
|
Items
|
Description
|
|
Dataset full name
|
Extreme high temperature dataset in Shanghai, China
|
|
Dataset short name
|
ExtrHighTemShanghai
|
|
Authors
|
Jiang, R. C-2756-2018, Shanghai HuaMin Environmental Science and Technology Development Company, jiangrong512@163.com
|
|
Year
|
1960-2013 and 2004-2014
|
|
Data format
|
.xlsx Data size 27.43 KB
|
|
|
|
Data files
|
The extreme high temperature weather in Shanghai from 1960 to 2013 and the extreme high temperature weather in all districts of Shanghai from 2004 to 2014
|
|
Data publisher
|
Global Change Research Data Publishing & Repository, http://www.geodoi.ac.cn
|
|
Address
|
No. 11A, Datun Road, Chaoyang District, Beijing 100101, China
|
|
Data sharing policy
|
Data from the Global Change Research Data Publishing & Repository includes metadata, datasets (data products), and publications (in this case, in the Journal of Global Change Data & Discovery). Data sharing policy includes: (1) Data are openly available and can be free downloaded via the Internet; (2) End users are encouraged to use Data subject to citation; (3) Users, who are by definition also value-added service providers, are welcome to redistribute Data subject to written permission from the GCdataPR Editorial Office and the issuance of a Data redistribution license; and (4) If Data are used to compile new datasets, the ‘ten percent principal’ should be followed such that Data records utilized should not surpass 10% of the new dataset contents, while sources should be clearly noted in suitable places in the new dataset[2]
|
3 Methods
Based on the meteorological data, a linear trend coefficient method was used to analyze the trends in summer daily maximum temperature, daily minimum temperature, and tropical nights in Shanghai from 1960 to 2013. A threshold method was used to determine the criteria for determining heat waves, and statistically evaluated the times, days and intensity of heat waves in Shanghai for the last several decades. The heat index was introduced to assess the state of human comfort under different climatic conditions. The generalized extreme distribution function was used to characterize the trends in extreme high temperature weather.
3.1 Index Definition and Calculation
(1) Tropical night
Research shows that a resting human body will lose more heat than is generated by the body at temperatures below 28 °C. Above this threshold, the amount of heat increases with the increase in temperature, which in turn affects human metabolism[3]. Using the definition for tropical night provided by climate variability and predictability (CLIVAR)[4], this article defines a night as a “tropical night” when its night temperature (minimum daily temperature) is higher than 28 °C.
(2) Heat wave
The high temperature heat wave index reflects the duration of summer high temperatures. This article uses the extreme high temperature defined by the China Meteorological Administration, which defines temperature higher than 35 °C as high temperature weather. Temperatures higher than 35 °C for five continuous days at a single station is defined as a high temperature heat wave[5].
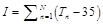
We analyzed the heat wave times, days and intensity in Shanghai. The heat wave times refer to the number of heat waves occurring at a certain station in summer; the heat wave days refer to the accumulation days of all heat waves at a certain station during the summer. The length of a heat wave also reflects the impact of heat waves; in general, longer duration heat waves have greater impacts. Heat wave intensity refers to the accumulation temperature of a heat wave at a certain station during the summer. The cumulative number that exceeds the high temperature threshold can more quantitatively reflect the impact strength of a heat wave in a certain year. The equations for heat wave days and heat wave intensity are:
 (1)
(1)
 (2)
(2)
where N is heat wave days in a year, ni is heat wave days in a heat wave, m is heat wave times in a year, I is heat wave intensity, and Tn is the high temperature in a heat wave.
(3) Hot day
The heat index is a comfortable indicator of thermal stress, originally proposed, developed, and modified by Thom and Bosen[6]; the specific equation to determine the index is as follows:
 (3)
(3)
 (4)
(4)
where ET is the heat index (°C), Ta is environment temperature (°C), which generally represents the highest temperature of the day, and RH is relative humidity (%).
To determine the hot days in Shanghai, the critical heat index data value was first determined using daily meteorological data (including daily maximum temperature and relative humidity) in the study area from June to September for 1960-2013, as in Huang et al. (2011)[7]. The heat index with the highest temperature greater than 33 °C was first calculated and ranked, and the 50th percentile was selected as the critical heat index. Second, the hot days were defined as the sum of the days with a heat index greater than the critical heat index.
(4) The generalized extreme distribution
Three distribution characteristic parameters, shape, scale, and position, of the generalized extreme value (GEV) distribution function can reflect long-term variation trends in extreme temperature; among these, the position parameter characterization has the best effect. In this study, the GEV distribution function was used to characterize extreme high temperature weather trends in the study area in summer. The model principle and data processing methods are summarized as follows:
(a) Theory
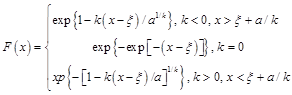
Let x1, x 2,…, xn be a sample of F(x), where (x1, x 2,…, xn) is called the order statistic. The minimum and maximum sample values are x1 and xn, respectively. The corresponding distribution is called the extreme distribution. Statisticians Fisher and Pete showed that the probability of a sample maximum after linear transformation of the distribution function converges to a random variable. The GEV model theoretical distribution function has the following expression:

 (5)
(5)
where  is the position parameter, a>0 is the scale parameter, and
  is the shape parameter. k<0 and k>0 respectively represent the Weibull and Frechet distributions.
(b) Data processing
The first step is to divide the data from Shanghai for 1960-2013 into 43 cycles, that is, 1960-1970 is the first cycle, 1961-1971 is the second cycle, and so on until 2003-2013, which is the 43rd cycle. The second step is to extract the highest temperature data for three days each year, sort the 33 data points in each cycle, and select the middle year as the representative year. The third step is to calculate the GEV distribution. This article primarily analyzes the trend in the position parameter.
3.2 Technical route
Based on the “China Daily Meteorological Data”, the meteorological data collected at the Shanghai Xuhui Station from 1960-2013 were used to obtain the municipality-level high-temperature indices, high-temperature heat wave indices, hot days, and generalized extreme distribution characteristics. The Bureau’s 2004-2014 meteorological statistics provided the daily maximum temperature, hot days, tropical nights, and heat wave indices on the Shanghai district scale. The flow chart for generating the extreme high temperature weather dataset in Shanghai is shown in Figure 1.
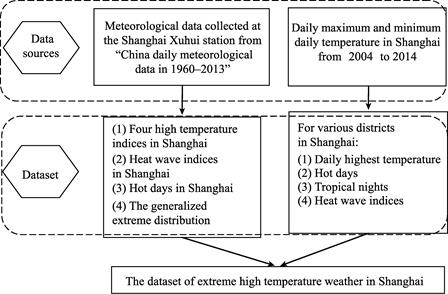
Figure 1 Flow chart for generating the extreme high temperature weather dataset in Shanghai
4 Results
4.1 Extreme High Temperature Weather in Shanghai
(1) Four high temperature indices
The daily highest temperature in Shanghai for summers during 1960-2013 is 39.9 °C (as of August 6, 2013), and the average maximum temperature is 37.0 °C. The daily minimum temperature also showed a significant upward trend. The daily maximum temperature in the summer before 2000 was generally below the mean value, and the daily maximum temperature from 2000 to 2013 was above average. In the past 54 years, extreme maximum temperatures in Shanghai have increased significantly, with a linear trend of 0.47 °C/10a.
According to previous research on the relationship between extreme high temperature and health[3], the frequency analysis of high temperature in Shanghai showed that there were 541 hot days (≥35 °C) and 33 dangerous high temperature days (≥38 °C) in Shanghai from 1960 to 2013, with annual averages of 10.02 days and 0.61 days, respectively. The highest number of hot days, 44, occurred in 2013.
(2) Heat wave indices
The annual number of heat waves in Shanghai each year varied between 0 and 3 from 1960 to 2013. Between 1960 and 1997, the maximum annual number of heat waves was
only once, and the 11 heat waves accounted for 39.29% of all heat waves. The total of 91 days of heat wave days accounted for 39.91% of all heat days and the total of 117.7 °C heat wave intensity accounted for 32.64% of all heat wave intensity. The Pearson correlation
coefficients between heat waves and heat wave days and heat waves and heat wave intensities are 0.951 and 0.954, respectively, which are significant at the 0.01 level. The Pearson correlation coefficient between heat waves and heat wave intensity is 0.876, which is slightly lower and significant at the 0.01 level.
(3) Hot days
In summary, the number of hot days showed an upward trend, with a linear trend rate of 0.174,7 from 1960 to 2013. The distribution of observation data is characterized by a low distribution between 1972 and 1984. After analyzing the number of hot days, they were divided into two phases. To calculate the linear trend rate for the two phases based on the transition between 1972 and 1984, the year with the largest difference between linear trend rates (the linear trend in the second phase minus the linear trend in the first phase) is the transition year. The number of hot days decreased from 1960 to 1975 and increased from 1976 to 2013. Linear fitting was performed on the two phases before and after 1976. A clear upward trend was found, with a linear tendency of -0.375 and 0.376,1 in first and second phases, respectively.
(4) The generalized extreme distribution
The generalized extreme distribution function can eliminate erroneous occurrences of extreme high temperatures and better represent trends in extreme high temperature weather. The position parameters of the generalized extreme distribution are shown in Figure 2. The results show that the position parameter value gradually increases after the 13th cycle, that is to say, after 1976, and extreme high temperatures clearly increase. This is in agreement with the development stage in Shanghai’s urbanization process.
4.2 Extreme High Temperature Weather in All Districts of Shanghai
(1) Daily highest temperature in various districts
|
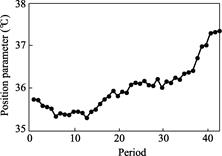
Figure 2 The position parameter for the GEV distribution
|
From 2004 to 2014, the maximum value of the maximum daily temperature in summer in each district was in the urban areas (2014) and the lowest value was in Fengxian district (2012). The average daily maximum temperatures for various districts in Shanghai are shown in Figure 3.
(2) Hot days in various districts
To demonstrate the overall situation at the ten sites, the total number of hot days in various districts of Shanghai was evaluated from 2004 to 2014. The maximum and minimum hot days at the ten weather stations occurred in 2013 and 2014, respectively. The difference between daily maximum
average temperature (Songjiang) and daily minimum average temperature (Baoshan) is only 0.5 °C. In contrast, the difference between the daily maximum average temperature (urban area) and minimum value (Baoshan) reaches 1.76 °C. As shown in Figure 4, the daily maximum temperature in the six districts is not much different.
(3) Tropical nights in various districts
Similar to the hot days, the total tropical nights in various districts of Shanghai from 2004 to 2014 were also evaluated. The average tropical nights in various districts of Shanghai are shown in Figure 5.
(4) Heat wave indices for various districts
|
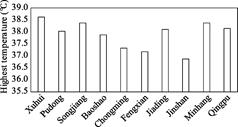
Figure 3 The daily average values for highest temperature in various districts of Shanghai
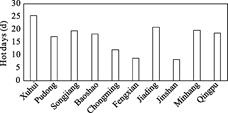
Figure 4 The average number of hot days in various districts of Shanghai
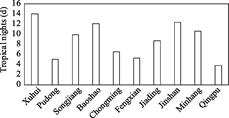
Figure 5 The average number of tropical nights in various districts of Shanghai
|
There is a significant correlation between the heat wave lengths, heat wave days, and heat wave intensity at the district level. However, the specific trends are different. Table 2 and Table 4 show the heat wave indices statistics for the various districts in Shanghai. The analysis of heat wave days in various districts of Shanghai from 2004 to 2014 shows that the highest number of heat wave days occurred in the urban areas (150 days), while the lowest occurred in Fengxian and Jinshan (20 days). The total heat wave intensities for various districts in Shanghai from 2004 to 2014 were analyzed. The maximum heat wave intensity value was found in the urban areas (289 °C), and the minimum value was found in Jinshan (41.8 °C).
For an analysis of the characteristics of extreme high temperature weather data in various districts from spatial and temporal perspectives, please refer to “Characteristics of extreme high temperature weather in Shanghai”[8].
Table 2 Heat wave times for various districts in Shanghai (Unit: Time)
| |
Xuhui
|
Pudong
|
Songjiang
|
Baoshan
|
Chongming
|
Fengxian
|
Jiading
|
Jinshan
|
Minxing
|
Qingpu
|
|
2004
|
2
|
1
|
1
|
1
|
0
|
0
|
1
|
0
|
1
|
1
|
|
2005
|
2
|
2
|
2
|
1
|
1
|
1
|
1
|
1
|
2
|
1
|
|
2006
|
2
|
1
|
0
|
0
|
0
|
0
|
1
|
0
|
0
|
1
|
|
2007
|
2
|
1
|
2
|
1
|
1
|
0
|
1
|
0
|
2
|
2
|
|
2008
|
1
|
0
|
0
|
1
|
0
|
0
|
1
|
0
|
0
|
0
|
|
2009
|
1
|
0
|
1
|
1
|
0
|
0
|
0
|
0
|
0
|
0
|
|
2010
|
3
|
1
|
1
|
2
|
1
|
1
|
2
|
1
|
2
|
1
|
|
2011
|
1
|
0
|
0
|
1
|
1
|
0
|
1
|
0
|
1
|
1
|
|
2012
|
3
|
1
|
1
|
0
|
0
|
0
|
2
|
0
|
1
|
1
|
|
2013
|
3
|
2
|
3
|
3
|
1
|
1
|
3
|
1
|
3
|
3
|
|
2014
|
0
|
0
|
0
|
0
|
0
|
0
|
0
|
0
|
0
|
0
|
5 Discussion and Conclusion
Although the metrological data from covering Shanghai was used including the climate data and the summer maximum temperature data, as well as the linear trend coefficient method was used in this study and dataset development, it would be more accurate if more detail local data and long term records could be used in this study. And the future research should be conducted to further refine the extreme high temperature spatial distribution characteristics.
Table 3 Heat wave days for various districts in Shanghai (Unit: Day)
| |
Xuhui
|
Pudong
|
Songjiang
|
Baoshan
|
Chongming
|
Fengxian
|
Jiading
|
Jinshan
|
Minxing
|
Qingpu
|
|
2004
|
16
|
6
|
10
|
10
|
0
|
0
|
10
|
0
|
8
|
10
|
|
2005
|
16
|
12
|
16
|
7
|
7
|
6
|
7
|
6
|
16
|
7
|
|
2006
|
10
|
5
|
0
|
0
|
0
|
0
|
5
|
0
|
0
|
5
|
|
2007
|
17
|
13
|
17
|
11
|
10
|
0
|
11
|
0
|
17
|
17
|
|
2008
|
7
|
0
|
0
|
5
|
0
|
0
|
5
|
0
|
0
|
0
|
|
2009
|
8
|
0
|
8
|
6
|
0
|
0
|
0
|
0
|
0
|
0
|
|
2010
|
17
|
6
|
6
|
11
|
5
|
6
|
11
|
6
|
11
|
5
|
|
2011
|
6
|
0
|
0
|
6
|
5
|
0
|
10
|
0
|
7
|
9
|
|
2012
|
20
|
6
|
6
|
0
|
0
|
0
|
11
|
0
|
6
|
6
|
|
2013
|
33
|
17
|
19
|
31
|
10
|
8
|
30
|
8
|
26
|
23
|
|
2014
|
0
|
0
|
0
|
0
|
0
|
0
|
0
|
0
|
0
|
0
|
Table 4 Heat wave Intensity for various districts in Shanghai (Unit: °C·day)
| |
Xuhui
|
Pudong
|
Songjiang
|
Baoshan
|
Chongming
|
Fengxian
|
Jiading
|
Jinshan
|
Minxing
|
Qingpu
|
|
2004
|
19.7
|
6.2
|
16.9
|
11.4
|
0
|
0
|
16.3
|
0
|
12.1
|
14.1
|
|
2005
|
37.2
|
23.7
|
24.2
|
13.3
|
8.1
|
9.6
|
12
|
7.9
|
29.2
|
11.8
|
|
2006
|
16.9
|
4.4
|
0
|
0
|
0
|
0
|
6.7
|
0
|
0
|
9.1
|
|
2007
|
43.1
|
25.1
|
38.7
|
18.2
|
18.4
|
0
|
28.3
|
0
|
38.8
|
40
|
|
2008
|
11.6
|
0
|
0
|
8.6
|
0
|
0
|
8.8
|
0
|
0
|
0
|
|
2009
|
14.4
|
0
|
13.2
|
10.4
|
0
|
0
|
0
|
0
|
0
|
0
|
|
2010
|
41.4
|
22.4
|
21.9
|
27.3
|
12.1
|
12.8
|
32.3
|
11.2
|
23.3
|
17
|
|
2011
|
8.9
|
0
|
0
|
7.8
|
2.6
|
0
|
11.1
|
0
|
4.9
|
6.7
|
|
2012
|
18.7
|
6.7
|
9.1
|
0
|
0
|
0
|
9.6
|
0
|
8.1
|
8.3
|
|
2013
|
77.1
|
48.4
|
62.4
|
58.1
|
23.7
|
21.1
|
69.4
|
22.7
|
62.3
|
65.3
|
|
2014
|
0
|
0
|
0
|
0
|
0
|
0
|
0
|
0
|
0
|
0
|
References
[1] Jiang, R. Extreme high temperature dataset in Shanghai, China [DB/OL]. Global Change Research Data Publishing & Repository, 2018. DOI: 10.3974/geodb.2018.01.18.V1.
[2] GCdataPR Editorial Office. GCdataPR Data Sharing Policy [OL]. DOI: 10.3974/dp.policy.2014.05 (Updated 2017).
[3] Tan, J. G., Lu, C., Chen, Z. H., et al. Heat Wave and Human Health [M]. Beijing: China Meteorological Press, 2009.
[4] Climate and ocean-variability, predictability, and change [Z]. http://www.Clivar.Org/Organization/Etccdi/ Etccdi.Php.
[5] Huynen, M. M., Martens, P., Schram, D., et al. The impact of heat waves and cold spells on mortality rates in the Dutch population [J]. Environmental Health Perspectives, 2001, 109(5): 463-470.
[6] Thom, E. C., Bosen, J. R. The discomfort index [J]. Weatherwise, 1959, 12: 59-60.
[7] Huang, Z., Chen, H., Tian, H. Research on the heat wave index [J]. Meteorological Monthly, 2011, 37 (3): 345-351.
[8] Jiang, R., Chen, L., Xiang, W. N. Characteristics of extreme high temperature weather in Shanghai [J]. Journal of Meteorology and Environment, 2016, 32(1): 66-74.