Dataset Development of Grain Self-sufficiency Capacity on
the Tibetan Plateau and Its Adjacent Area (1985-2016)
Shi, W. J.1, 2* Ding, R.1, 2 Cui, J. Y.3 Shi, X. L.3*
1. Key Laboratory of Land Surface Pattern and Simulation, Institute
of Geographic Sciences and Natural Resources Research, Chinese Academy of
Sciences, Beijing 100101, China;
2. College of Resources and Environment, University of
Chinese Academy of Sciences, Beijing 100049, China;
3. School of Geographical Sciences, Hebei Normal
University, Hebei Key Laboratory of Environmental Change and Ecological
Construction, Hebei Technology Innovation Center for Remote Sensing
Identification of Environmental Change, Hebei, Shijiazhuang 050024, China
Abstract: The security of grain supply and demand on the Tibetan Plateau is
related to the stability of the border region and is an important foundation
for regional sustainable development. Based on the statistical data from 1985
to 2016, the grain self-sufficiency rate and supply-demand gap were used to analyze
the spatial and temporal patterns of grain supply and demand at regional,
provincial, and county scales on the Tibetan Plateau and its adjacent area. The
results showed that the grain self-sufficiency of the Tibetan Plateau showed an
upward trend from 1985 to 2016, but the spatial distribution of the balance of
grain supply and demand was quite different. The dataset includes: (1) annual
capacity for grain self-sufficiency on the Tibetan Plateau and its adjacent
area during 1985-2016; (2) capacity for grain self-sufficiency in each province of
the Tibetan Plateau in different periods from 1985 to 2016; (3) average
capacities for grain self-sufficiency at the county level on the Tibetan
Plateau and its adjacent area from 2010 to 2016. The dataset is archived in
.xlsx and .shp data formats, and consists of 8 data files with data size of
20.3 MB (compressed into one single data file with 6.58 MB).
Keywords: Tibetan Plateau; grain; self-sufficiency; county-level
DOI: https://doi.org/10.3974/geodp.2022.03.10
CSTR: https://cstr.escience.org.cn/CSTR:20146.14.2022.03.10
Dataset Availability Statement:
The dataset
supporting this paper was published and is accessible through the Digital Journal of Global Change Data
Repository at: https://doi.org/10.3974/geodb.2021.11.09.V1
or https://cstr.escience.org.cn/CSTR:20146.11.2021.11.09.V1.
1 Introduction
Food security is related to national security and social
stability[1,2]. The Tibetan Plateau (TP) has less cultivated land
with poor quality and low yield, and the agriculture is sensitive to climate
change. These characteristics have limited the development of plateau
agriculture and social economy[3–5]. The agricultural production and
the level of food security of the TP are relatively low, and it is one of the
areas with the most food shortage in China[6,7]. The research on the
balance of grain supply and demand on the TP is related to regional sustainable
development strategies[8]. Therefore, it is of great significance to
assess the food security situation and improve the balance of grain supply and
demand on the TP.
Grain
supply and demand is the relationship between grain consumption and production,
and is a key component for ensuring food security[9]. The grain
self-sufficiency rate is an important indicator to measure the degree of grain
self-sufficiency and reflect the level of food security[10]. Most of
the existing researches calculate the self-sufficiency rate at the national or
provincial scales, and there are few researches at the county scale on the TP.
This dataset is based on the data of county-level population, grain production,
and provincial per capita grain consumption of urban and rural residents from
1985 to 2016 to obtain the spatial and temporal patterns of grain supply and
demand at the regional, provincial, and county scales on the TP. Our study aims
to provide data support and reference for the sustainable development and the
spatial regulation strategy of regional agriculture and animal husbandry on the
TP.
2 Metadata
of the Dataset
We summarized the metadata of the Dataset of grain self-sufficiency capacity on the Tibetan
Plateau and its adjacent area (1985-2016)[11] (Table
1). The metadata includes the dataset name, authors, geographical region, year
range, temporal resolution, spatial resolution, data files, data publisher, and
data sharing policy, etc.
3 Methods
Statistical data in the study area include county-level
grain production, provincial-level per capita annual consumption of urban and
rural residents, and county-level population of urban and rural residents from
1985 to 2016. The above data were extracted from Qinghai Statistical
Yearbook (1986-2017)[13], Tibet Statistical Yearbook (1993-2017)[14], Sichuan Statistical Yearbook (1987-2017)[15], Gansu Development Yearbook (1986-2017)[16], Yunnan Statistical Yearbook (1986-2017)[17], Xinjiang Statistical Yearbook (1989-2017)[18], China Statistical Yearbook (County-level) (2000-2017)[19], China Population & Employment Statistics Yearbook[20]
and Tabulation on the Population Census of the People??s Republic of China by
County[21].
The dataset covers 202 counties (districts) on the TP.
There are 6 counties without any residential areas, including Ruoqiang county,
Qira county, Hotan county, Pishan county, Yecheng county and Akto county in
Xinjiang. The boundary of the study area in Yutian county, Minfeng county,
Qiemo county, Minle county and Shandan county was clipped according to the 2,500
m contour line. We removed the outliers, and replaced the missing data with the
mean value of adjacent years.
3.1 Algorithm
Based on the population and grain production in the county-level,
and provincial per
Table 1 Metadata summary of the
Dataset of grain self-sufficiency capacity on the Tibetan Plateau and its
adjacent area (1985-2016)
|
Items
|
Description
|
|
Dataset
full name
|
Dataset
of grain self-sufficiency capacity on the Tibetan Plateau and its adjacent
area (1985-2016)
|
|
Dataset
short name
|
GrainSS_QTP_1985-2016
|
|
Authors
|
Shi,
W. J. S-3255-2018, Institute of Geographic Sciences and Natural Resources
Research, Chinese Academy of Sciences, shiwj@lreis.ac.cn
Ding,
R., Institute of Geographic Sciences and Natural Resources Research, Chinese
Academy of Sciences, dingrui_1998@163.com
|
|
|
Cui,
J. Y., School of Geographical Sciences, Hebei Normal University, cuijiaying115@163.com
|
|
Geographical
region
|
The
Qinghai-Tibet Plateau and its adjacent area
|
|
Year
|
1985-2016
|
|
Temporal
resolution
|
Annual
|
|
Spatial
resolution
|
County
scale
|
|
Data
format
|
.xlsx, .dbf, .prj, .sbn, .shp, .shx, .xml, .kml
|
|
|
|
Data
size
|
20.3
MB (6.58 MB after compression)
|
|
|
|
Data
files
|
The
dataset consists of eight files, stored in .shp and .xlsx formats. The table
data includes 3 sheet tables: (1) annual capacity for grain
self-sufficiency on the Tibetan Plateau and its adjacent area during 1985-2016;
(2) capacity for grain self-sufficiency in each province of the Tibetan
Plateau and its adjacent area in different periods from 1985 to 2016; (3)
average capacities for grain self- sufficiency at the county level on the
Tibetan Plateau and its adjacent area from 2010 to 2016
|
|
Foundations
|
Chinese
Academy of Sciences (XDA20040301, XDA20010202, XDA23100202)??National
Natural Science Foundation of China (41771111)
|
|
Data
publisher
|
Global Change Research Data Publishing & Repository,
http://www.geodoi.ac.cn
|
|
Address
|
No.
11A, Datun Road, Chaoyang District, Beijing 100101, China
|
|
Data
sharing policy
|
Data from
the Global Change Research Data Publishing & Repository includes metadata, datasets
(in the Digital Journal of Global Change Data Repository), and
publications (in the Journal of Global Change Data & Discovery). Data sharing policy
includes: (1) Data are openly available and can be free downloaded via the
Internet; (2) End users are encouraged to use Data subject to citation;
(3) Users, who are by definition also value-added service providers, are
welcome to redistribute Data subject to written permission
from the GCdataPR Editorial Office and the issuance of a Data redistribution
license; and (4) If Data are used to compile new
datasets, the ??ten per cent principal?? should be followed such that Data
records utilized should not surpass 10% of the new dataset contents, while
sources should be clearly noted in suitable places in the new dataset[12]
|
|
Communication
and searchable system
|
DOI, CSTR, Crossref, DCI, CSCD, CNKI, SciEngine, WDS/ISC,
GEOSS
|
capita consumption on the TP from
1985 to 2016, we differentiated the per capita consumption levels between urban
and rural residents on the TP, and multiplied it by the county-level urban and
rural population to obtain the county-level urban and rural grain consumption.
The ratio and difference between grain production and grain consumption are the
grain self-sufficiency rate and the grain supply-demand gap, respectively.
Based on this, the spatial and temporal differences of grain self-sufficiency
rates and supply-demand gaps at the regional, provincial and county scales from
1985 to 2016 were scientifically evaluated to reflect the grain
self-sufficiency on the TP and its adjacent area.
3.2 Data Development Process
We used the county-level statistical data from 1985 to 2016
to develop this dataset, and the following steps were carried out (Figure 1):
(1) Statistical data at the county scale in the study area
were collected and sorted, and data cleaning, abnormal value processing, etc.
were carried out;
(2) The grain consumption of each county was calculated by
multiplying the provincial per capita consumption by the county-level
population of urban and rural residents;
|
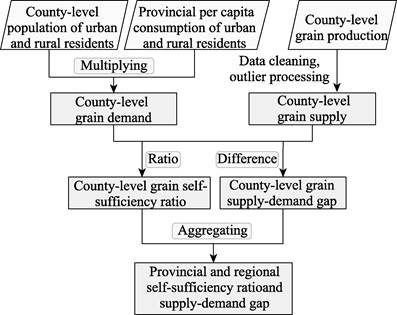
Figure 1 Flowchart of the dataset
development
|
(3) According to the ratio and difference between
county-level grain production and consumption, the grain self-sufficiency
rate and the supply-demand gap were calculated, respectively;
(4) Aggregating the county-level data to provincial and
regional scales, data of grain self-sufficiency were obtained at these two
scales;
(5) Finally, the spatial and temporal patterns of the
balance of grain supply and demand on the TP and its adjacent areas were
analyzed.
4 Data Results
and Validation
4.1 Data Composition
The dataset of grain
self-sufficiency capacity on the Tibetan Plateau and its adjacent area (1985-2016) includes the boundaries of
the county-level administrative units of the TP and the data of grain
self-sufficiency at different scales. The data include three perspectives of
the whole regional scale, the provincial scale during different periods, and
the county-level scale from 2010 to 2016, to reflect the grain self-sufficiency
of the TP and its adjacent area from 1985 to 2016. Table 1 (in the dataset)
shows the overall self-sufficiency information on the TP and its adjacent area
from 1985 to 2016. The specific indicators include grain production, grain
consumption, grain self-sufficiency rate, supply-demand gap, and per capita
grain consumption of urban and rural residents. Table 2 (in the dataset) shows
the grain self-sufficiency status of provinces on the TP and its adjacent area
during the four periods of 1985-1989, 1990-1999, 2000-2009, and 2010-2016. The specific indicators
include grain production, grain consumption, grain self-sufficiency rate, and
supply-demand gap. Table 3 (in the dataset) shows the average county-level
grain self-sufficiency on the TP and its adjacent area from 2010 to 2016. The
specific indicators include grain production, grain consumption, grain
self-sufficiency rate, and supply-demand gap. The attribute information of
grain supply and demand indicators is shown in Table 2.
Table 2 Attribute information of the dataset on
the Tibetan Plateau and its adjacent area
|
Index
|
Abbreviation
|
Attribute
|
Unit
|
|
1
|
P
|
Grain production
|
104 t
|
|
2
|
C
|
Grain consumption
|
104 t
|
|
3
|
SS
|
Self-sufficiency rate
|
%
|
|
4
|
SDG
|
Supply-demand gap
|
104 t
|
4.2 Data Results
4.2.1 Regional Grain Self-sufficiency of the TP and its Adjacent
Area
The grain self-sufficiency rates of the TP and its adjacent
area has maintained an increasing trend since 2005. The self-sufficiency rate
of the TP shows that the grain supply can mainly meets the demand (Figure 2).
The overall grain self-sufficiency rate of the TP and its adjacent area has
remained above 120% all year round. With the improvement of the
self-sufficiency rate, the grain supply-demand gap has been continuously
reduced. After 2014, the grain supply exceeded the demand by more than 2.5
million tons. The increasing trend of grain self-sufficiency rate depends on
the increase in grain production and the decline in grain consumption. The
overall grain consumption of the TP and its adjacent area is over 3 million
tons, and the grain production increased from 4.05 million tons in 1989 to 6.14
million tons in 2016.
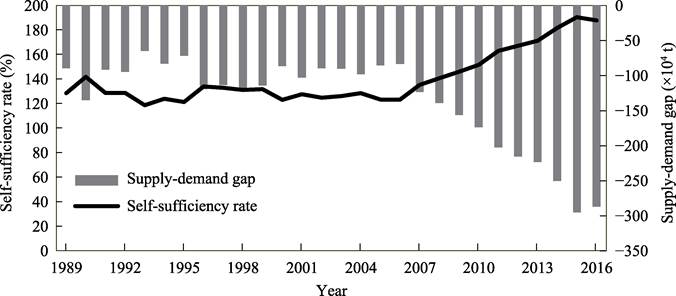
Figure 2 Changes in grain
self-sufficiency rate and supply-demand gap on the TP and its adjacent area
4.2.2 Provincial Grain Self-sufficiency of the TP and its
Adjacent Area
Statistical analysis of grain self-sufficiency according to
provincial-level administrative units showed that, except for the Xinjiang
part, all other provinces were able to achieve grain self-sufficiency from 2010
to 2016 (Figure 3). Among the provinces, Sichuan and Yunnan had the best
self-sufficiency rates and had an increasing trend. From 2010 to 2016, their
self-sufficiency rate was greater than 190%, and the supply exceeded demand by
more than 600,000 tons. Except for Qinghai from 2000 to 2009, Qinghai and Tibet
had relatively poor self-sufficiency rates, but they were both able to achieve
self-sufficiency at the provincial level, with grain supply exceeding demand by
250,000 t and 480,000 t, respectively, during 2010-2016.
Gansu part could not achieve grain self-sufficiency before
2010, but it successfully achieved grain self-sufficiency between 2010 and 2016, with the grain supply exceeding demand by
380,000 tons. Xinjiang part could not be self-sufficient in all periods, but
because of its small area on the TP, their grain shortage was only less than
10,000 tons.
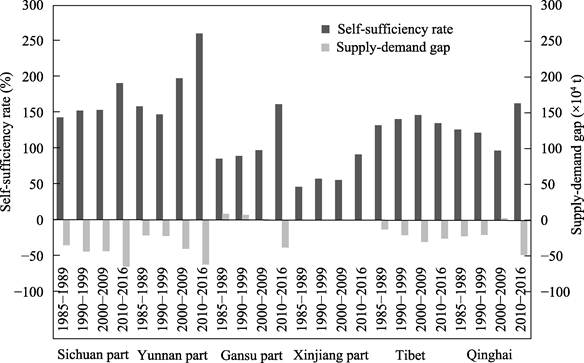
Figure 3 Provincial changes in grain
self-sufficiency rate and supply-demand gap on the TP and its adjacent area
|
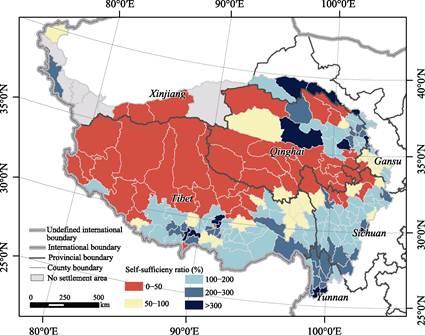
Figure 4 The grain self-sufficiency rates at the
county scale on the TP and its adjacent area from 2010 to 2016
|
4.2.3 County-level Grain Self-sufficiency of the TP
and its Adjacent Area
According
to the spatial distribution of the grain self-sufficiency rate at the county
scale on the TP from 2010 to 2016, it can be seen that the grain
self-sufficiency in southern Tibet, eastern Qinghai, Sichuan, and Yunnan was
relatively favorable, and the grain self-sufficiency rate in the central region
was relatively low (Figure 4). Areas with better grain self-sufficiency on the
TP and its adjacent area were mainly distributed in agricultural areas, such
as in the Yarlung Zangbo River, Nyangqu River, and Lhasa River Region (YNL) in
southern Tibet and the Huangshui Valley agricultural area in eastern Qinghai.
The Qiangtang Plateau in northern Tibet and the Hoh Xil region in western
Qinghai were mostly uninhabited areas and animal husbandry areas, with low
population density and basically no planting areas, so basic grain supply
cannot be guaranteed. At the county level, a total of 42% of the counties on
the TP and its adjacent area cannot achieve a balanced status between grain
supply and demand (the grain self-sufficiency rate was less than 100%). Among
the provinces, counties in Yunnan part had the best grain self-sufficiency, with
all counties achieve self-sufficiency. The supply and demand status of Sichuan
part was relatively good, and only 23% of the counties cannot achieve grain
self-sufficiency. Tibet, Gansu, and Qinghai accounted for 42%, 50%, and 55% of
the counties that could not achieve a balance status between grain supply and
demand, respectively. Among the 11 county-level administrative units in
Xinjiang, only Tashkurgan Tajik Autonomous County can achieve self-sufficiency.
5 Discussion and Conclusion
To
clarify the temporal and spatial differences in the balance of grain supply and
demand on the TP and its adjacent
area at different scales, we calculated the grain self-sufficiency rate and the
supply-demand gap at the regional, provincial, and county scales based on statistical
data, then the spatial and temporal
patterns of grain self-sufficiency on the TP were described. The grain
self-sufficiency on the TP showed an increasing trend from 1985 to 2016, but
the spatial distribution at the county scale was quite different. This dataset
can provide scientific support for the regulation of the spatial distribution
of grain supply and demand status and the sustainable development of
agriculture on the TP. Due to the limitations of the original statistical data,
the grain consumption calculated in this dataset was based on the provincial
per capita grain consumption of urban and rural residents, and the difference
in per capita consumption at the county scale has not been reflected. Besides,
the grain consumption calculated in this dataset was mainly for staple grain
and has not considered the consumption of feed grains for meat production and
other aspects of grain demand such as industrial grain and seed.
Author Contributions
Shi, W. J. and Shi, X. L. developed
the overall design and model algorithm for the dataset; Shi, W. J, Shi, X. L. and
Ding, R. completed the data verification, wrote and revised the data paper;
Cui, J. Y. collected and processed the statistical yearbook data.
Conflicts of Interest
The
authors declare no conflicts of interest.
References
[1] Cheng, S. K., Li, Y. Y., Liu, X. J., et al. Thoughts on food
security in China in the new period [J]. Journal of Natural Resources,
2018, 33(6): 911‒926.
[2] Tang, H. J. China??s grain self-sufficiency strategy in the new situation
[J]. Issues in Agricultural Economy, 2014, 35(2): 4‒10, 110.
[3] Ding, R., Shi, W. J. Quantitative evaluation of the effects of
climate change on cereal yields of Tibet during 1993‒2017 [J]. Acta
Geographica Sinica, 2021, 76(9): 2174‒2186.
[4] Yang, C. Y., Shen W. S., Li, D. H. Response of grain yield in Tibet
to climate and cultivated land change during 1985‒2010 [J]. Transactions of
the Chinese Society of Agricultural Engineering, 2015, 31(17): 261‒269.
[5] Ding, R., Shi, W. J. Contributions of climate change to cereal
yields in Tibet, 1993–2017 [J]. Journal of Geographical Sciences, 2022,
32(1): 101‒116.
[6] Duan J., Xu, Y., Sun, X. Y. Spatial patterns and their changes of
grain production, grain consumption and grain security in the Tibetan Plateau
[J]. Journal of Natural Resources, 2019, 34(4): 673‒688.
[7] Gao, L. W., Xu, Z. R., Chen, S. K., et al. Food security
situation and major grain supply and demand in Tibetan region [J]. Journal
of Natural Resources, 2017, 32(6): 951‒960.
[8] Xu, Z. R., Zhang, Y. L., Cheng, S. K., et al. Scientific
basis and the strategy of sustainable development in Tibetan Plateau [J]. Science
& Technology Review,
2017, 35(6): 108‒114.
[9] Hu, T., Ju, Z. S., Zhou, W. Regional pattern of grain supply and
demand in China [J]. Acta Geographica Sinica, 2016, 71(8): 1372‒1383.
[10] Yang, M. Z., Pei, Y. S., Li, X. D. Study on grain self-sufficiency
rate in China: an analysis of grain, cereal grain and edible grain [J]. Journal
of Natural Resources, 2019, 34(4): 881‒889.
[11] Shi, W. J., Ding, R., Cui, J. Y. Dataset of grain self-sufficiency
capacity on the Tibetan Plateau and its adjacent area (1985‒2016) [J/DB/OL]. Digital
Journal of Global Change Data Repository, 2021. https://doi.org/10.3974/geodb.2021.11.09.V1.
https://cstr.escience.org.cn/CSTR:20146.11.2021.11.09.V1.
[12] GCdataPR Editorial Office. GCdataPR data sharing policy [OL].
https://doi.org/10.3974/dp.policy.2014.05 (Updated 2017).
[13] Bureau of Statistics of Qinghai Province. Qinghai Statistical
Yearbook (1986‒2017) [M]. Beijing: China Statistics Press, 1986‒2018.
[14] Bureau of Statistics of Tibet Autonomous Region. Tibet Statistical
Yearbook (1993‒2017) [M]. Beijing: China Statistics Press, 1994‒2018.
[15] Bureau of Statistics of Sichuan Province. Sichuan Statistical Yearbook
(1987‒2017) [M]. Beijing: China Statistics Press, 1988‒2018.
[16] Editorial Board of Gansu Development Yearbook. Gansu Development
Yearbook (1986‒2017) [M]. Beijing: China Statistics Press, 1985‒2018.
[17] Bureau of Statistics of Yunnan Province. Yunnan Statistical Yearbook
(1986‒2017) [M]. Beijing: China Statistics Press, 1985‒2018.
[18] Bureau of Statistics of Xinjiang Uygur Autonomous Region, Xinjiang
Statistical Yearbook (1989‒2017) [M]. Beijing: China Statistics Press,
1990‒2018.
[19] Department of Rural Socioeconomic Investigation, National Bureau of
Statistics. China Statistical Yearbook (County-level) (2000‒2017) [M]. Beijing:
China Statistics Press, 2001‒2018.
[20] Department of Population and Employment Statistics, National Bureau
of Statistics. China Population & Employment Statistics Yearbook
(1988‒2017) [M]. Beijing: China Statistics Press, 1989‒2018.
[21] Department of Population and Employment Statistics, National Bureau
of Statistics. Tabulation on the Population Census of the People??s Republic of
China by County [M]. Beijing: China Statistics Press, 2011.