Reanalysis Dataset on MODIS-NDVI in Southeast
Asia, 2010
Wang, Z. X.1* Cao, Y. F.2
1. Institute of Geographical Sciences and Natural Resources Research??Chinese Academy of Sciences State Key Lab of Resources and Environmental Information System, Beijing 100101, China??
2. Beijing Forestry University, Beijing 100083, China
Abstract: MODIS-NDVI is one of the most widely used parameters for global change research, but the noises from various factors have gravely impaired its credibility. This happens especially in cloudy Southeast Asia. This reanalysis dataset ameliorate the noise problem in two steps. First, two 16-day time NDVI serials (Terra- and Terra-MODIS) were combined into 8-day serials by actual DOY (Day of the Year, 2010) and QA (Quality Assurance). Second, newly formed 8-day NDVI time serials were reanalyzed using S-G algorithm. By using QA as weight factor, good quality data were reserved, and poor data were rebuilt. Visual inspection showed that noises from residual clouds were greatly removed, and spatial patterns and temporal profiles became more informative. The 8-day/Monthly 250 m dataset are delivered in 58 files with .tif data format, the data size is 47.68 GB.
Keywords: MODIS-NDVI; time serial; data quality; reanalysis; Southeast Asia
1 Introduction
The Southeast Asian Region is one of the three important tropical rainforest areas in the world, and it is also a region with mounting population pressure and fast land cover and land use (LCLU) changes. Remote sensing has been one of the most effective tools to monitor LCLU processes and to facilitate sound land use policy making. However, due to the cloudy and rainy weather conditions, Vegetation Indices like NDVI developed by optical remote sensing observation often contain a lot of noises, and hinder the better application of NDVI to the study of resources and environment in the Southeast Asian Region. This data paper presents a novel method to develop a less noisy, 8-day time serial MODIS-NDVI by merging MOD- and MYD-NDVI. First, the 16-day MOD-NDVI and MYD NDVI time serial in 2010 were merged into an 8-day time serial according to the actual pixel time (Day of the Year, DOY). Then, a less noisy 8-day time serial was developed using S-G algorithm and Quality Assurance (QA). Finally, the visual comparison of before- and after-reconstruction images showed the improved data quality in terms of temporal and spatial smoothness. And a quantitative analysis illustrated that quality of 27% of the pixels were improved.
2 Metadata of Dataset
The major elements of the re-constructed 8-day, 250 m MODIS-NDVI time serial of the Southeast Asian Region in 2010[1] were listed in Table 1. The data scale was 10,000.
Table 1 Metadata of reanalysis dataset of MODIS-NDVI in Southeast Asia, 2010
|
Items
|
Description
|
|
Dataset full name
|
Reanalysis dataset of MODIS-NDVI in Southeast Asia, 2010
|
|
Dataset short name
|
MODIS-NDVI_8d250m_SEA2010
|
|
Authors
|
Wang, Z. X. L-5255-2016, Institute of Geographical Sciences and Natural Resources Research, Chinese Academy of Sciences, wangzx@igsnrr.ac.cn
|
|
|
Cao, Y. F. S-1593-2016, Beijing Forestry University, yfcao@bjfu.edu.cn
|
|
Geographical region
|
10.95°S–28.57°N, 92.18°E–141.03°E
Brunei, Cambodia, Indonesia, Laos, Malaysia, Myanmar, Philippines, Singapore, Thailand, and Vietnam??Southern coastal area of China
|
|
Time
|
2010
|
|
Temporal resolution
|
8 day, monthly
|
|
Spatial resolution
|
250 m
|
|
Map Projection
|
WGS84/Geographic
|
|
Data format
|
.tif, .rar
|
|
Data files
|
58 .tif data files
|
|
Data size
|
47.68 GB (179 MB for each .tif WinRAR file; 9.77 GB for all WinRAR files)
|
|
Foundation(s)
|
Ministry of Science and Technology of P. R. China (2016YFA0600201, 2015DFA11360);
Chinese Academy of Science??KZZD-EW-08-01-02-01, TSYJS04??
|
|
Data publisher
|
Global Change Research Data Publishing and Repository, http://www.geodoi.ac.cn
|
|
Address
|
No. 11A, Datun Road, Chaoyang District, Beijing 100101, China.
|
|
Data sharing policy
|
Data from the Global Change Research Data Publishing & Repository includes metadata, datasets (data products), and publications (in this case, in the Journal of Global Change Data & Discovery). Data sharing policy includes: (1) Data are openly available and can be free downloaded via the Internet; (2) End users are encouraged to use Data subject to citation; (3) Users, who are by definition also value-added service providers, are welcome to redistribute Data subject to written permission from the GCdataPR Editorial Office and the issuance of a Data redistribution license; and (4) If Data are used to compile new datasets, the ‘ten per cent principal’ should be followed such that Data records utilized should not surpass 10% of the new dataset contents, while sources should be clearly noted in suitable places in the new dataset[2]
|
3 Methodology
This dataset was developed based on the integration and refinement of previous researches. The two basic data inputs (MOD13Q1, MYD13Q1) are from Collection 5 (C5)[3]. Comparative studies of the performance of three algorithms in Timesat software were described in two literatures[4–5]. The method of doubling time serial from 16-day to 8-day was given by paper[6]. More detailed information about data Quality Assurance can be found in paper[7]. This paper only briefly introduces the integration and improvement in the reconstruction of MODIS-NDVI time series in Southeast Asia.
Three layers were used in MOD13Q1 and MYD13Q1: NDVI (MOD-, MYD-), Day of Year (DOY), and Quality Assurance (QA). Three steps followed:
(1) Doubling NDVI temporal resolution from 16-day to 8-day??Mainly based on actual DOY in pixel level, conducted in IDL 8.1.
(2) Reconstruction of 8-day NDVI time serial??Timesat GUI was used for optimal parameterization, and then parameters were applied to all data, conducted in Timesat 2.3.
(3) Post Reconstruction??High quality data were used to check the outliers, conducted in ENVI4.8.
3.1 Doubling Temporal Resolution from 16-Day to 8-Day
In file level, MYD- was 8 days later than MOD-NDVI [6], yet in pixel level, given an 8-day composite period, there were three possibilities: (1) Both MOD- and MYD-NDVI appeared; (2) Only one of MOD- and MYD-NDVI existed; (3) None of MOD-and MYD-NDVI showed up (Figure 1).
|
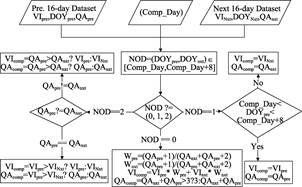
Figure 1 Flow chart of doubling MODIS-NDVI time serial
|
Accordingly, there were three approaches to double temporal resolution from 16-day to 8-day.
(1) Both MOD-NDVI and MYD-NDVI appeared: Number of Data (NOD) =2.
If MOD-QA ≠ MYD-QA, then select NDVI with smaller QA (higher quality) ;
If MOD-QA = MYD-QA, then select NDVI with bigger value.
In both cases, the corresponding QA would also be recorded into new 8-day time serial file.
(2) Only one of MOD-NDVI and MYD-NDVI existed: Number of Data (NOD) =1
IF No. of DOY = 1, then this NDVI and its QA would be chosen.
(3) None of MOD- and MYD-NDVI showed up??In this case, there was no NDVI directly from MOD- and MYD-NDVI input, and the QA would be set to 3 (lowest quality). This non-data pixel, together with other pixels with lower quality, would be re-constructed in following step.
3.2 Reconstruction of 8-Day NDVI Time Serial
(1) Algorithm : Savitzky-Golay (S-G) filter provided in TIMESAT software package.
(2) Weight from QA: NDVI QA was a key factor for NDVI time serial reconstruction. In order to use as more pixel as possible to form an less noisy, new 8-day time serial??all raw data should be included in input. Therefore, we developed a lower criteria for the transformation of QA into weight:
Weight =1 for QA0; weight =0.5 for QA1and QA2; weight =0.1 for QA3.
NDVI QA for Julian calendar DOY1-DOY153, 2010, was illustrated in Figure 2. In DOY153 composite period, numbers of pixels with QA3 (low quality) accounted for 40% of all pixels, with the advent of summer monsoon.
(3) Spike parameter: 1.65; denoting, confidential level = 95%.
(4) Season parameter: 0.5; suitable for double or triple cropping per year.
(5) Adaptation strength: 2; the strength to force data into model. Using default value, moderate level.
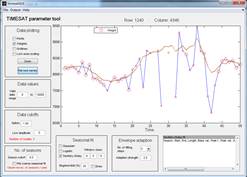
(6) S-G window: 4, 5, 6; There were three iterations for reconstruction, in 4, 5, and 6 temporal windows, respectively (Figure3).
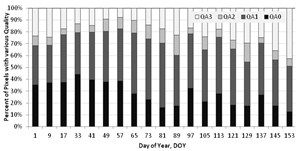
Figure 2 Quality assurance (QA) of MODIS-NDVI during DOY001–DOY 152, 2010
3.3 Post Reconstruction
Two steps were taken to preliminarily verify the quality of reconstruction. First, check whether all NDVI values fell into the valid range (-2,000, 10,000). Second, look over the changes of NDVI with good quality (QA0): It was assumed that good reconstruction should maintain good data, a too much deviation from the raw input should be restored (here, we set the threshold, NDVIchange=2,000). More detailed validation was conducted in validation.
|
|
|
|
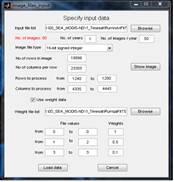
Parameter setting
|
Effect: blue line was from raw data, brown line from the
result of filtering
|
Figure 3 Parameter setting and effect using S-G filter in Timesat package
4 Reconstructed Data Product and Validation
Reconstructed data product is consisted of monthly data files and 8-day composite data files. The performance of reconstruction can be evaluated both quantitatively and qualitatively. Specifically, there were three approaches to demonstrate the improvement.
4.1 Data Product
The data product is consisted of 58 .tif files, including 12 monthly data files (Table 2) and 46 8-day data files (Table 3) with 250 m spatial resolution.
Table 2 Monthly data files of reanalysis dataset on MODIS-NDVI in Southeast Asia, 2010
|
Data file title
|
Data size (KB)
|
|
1_SEA_Rea_MODIS-NDVI_2010_JAN.rar
|
176,096.10
|
|
2_SEA_Rea_MODIS-NDVI_2010_FEB.rar
|
175,212.03
|
|
3_SEA_Rea_MODIS-NDVI_2010_MAR.rar
|
175,327.30
|
|
4_SEA_Rea_MODIS-NDVI_2010_APR.rar
|
175,900.24
|
|
5_SEA_Rea_MODIS-NDVI_2010_MAY.rar
|
176,199.49
|
|
6_SEA_Rea_MODIS-NDVI_2010_JUN.rar
|
178,383.50
|
|
7_SEA_Rea_MODIS-NDVI_2010_JUL.rar
|
179,857.91
|
|
8_SEA_Rea_MODIS-NDVI_2010_AUG.rar
|
178,859.01
|
|
9_SEA_Rea_MODIS-NDVI_2010_SEP.rar
|
177,037.20
|
|
10_SEA_Rea_MODIS-NDVI_2010_OCT.rar
|
174,397.40
|
|
11_SEA_Rea_MODIS-NDVI_2010_NOV.rar
|
175,371.10
|
|
12_SEA_Rea_MODIS-NDVI_2010_DEC.rar
|
175,905.04
|
Table 3 8-day composite data files of reanalysis dataset on MODIS-NDVI in Southeast Asia, 2010
|
Data file title
|
Data size (KB)
|
Data file title
|
Data Size (KB)
|
|
SEA_Rea_MODIS-NDVI_2010-001.rar
|
176,967.56
|
SEA_Rea_MODIS-NDVI_2010-185.rar
|
179,419.49
|
|
SEA_Rea_MODIS-NDVI_2010-009.rar
|
176,989.77
|
SEA_Rea_MODIS-NDVI_2010-193.rar
|
180,214.66
|
|
SEA_Rea_MODIS-NDVI_2010-017.rar
|
176,020.70
|
SEA_Rea_MODIS-NDVI_2010-201.rar
|
180,736.62
|
|
SEA_Rea_MODIS-NDVI_2010-025.rar
|
175,513.47
|
SEA_Rea_MODIS-NDVI_2010-209.rar
|
180,454.42
|
|
SEA_Rea_MODIS-NDVI_2010-033.rar
|
175,098.94
|
SEA_Rea_MODIS-NDVI_2010-217.rar
|
179,693.48
|
|
SEA_Rea_MODIS-NDVI_2010-041.rar
|
175,137.40
|
SEA_Rea_MODIS-NDVI_2010-225.rar
|
179,117.06
|
|
SEA_Rea_MODIS-NDVI_2010-049.rar
|
175,010.29
|
SEA_Rea_MODIS-NDVI_2010-233.rar
|
178,720.78
|
|
SEA_Rea_MODIS-NDVI_2010-057.rar
|
175,040.92
|
SEA_Rea_MODIS-NDVI_2010-241.rar
|
178,210.19
|
|
SEA_Rea_MODIS-NDVI_2010-065.rar
|
175,189.89
|
SEA_Rea_MODIS-NDVI_2010-249.rar
|
177,686.87
|
|
SEA_Rea_MODIS-NDVI_2010-073.rar
|
175,419.63
|
SEA_Rea_MODIS-NDVI_2010-257.rar
|
177,237.44
|
|
SEA_Rea_MODIS-NDVI_2010-081.rar
|
175,610.37
|
SEA_Rea_MODIS-NDVI_2010-265.rar
|
176,841.12
|
|
SEA_Rea_MODIS-NDVI_2010-089.rar
|
175,757.41
|
SEA_Rea_MODIS-NDVI_2010-273.rar
|
176,198.74
|
|
SEA_Rea_MODIS-NDVI_2010-097.rar
|
175,830.47
|
SEA_Rea_MODIS-NDVI_2010-281.rar
|
175,003.33
|
|
SEA_Rea_MODIS-NDVI_2010-105.rar
|
176,116.94
|
SEA_Rea_MODIS-NDVI_2010-289.rar
|
174,313.30
|
|
SEA_Rea_MODIS-NDVI_2010-113.rar
|
176,405.35
|
SEA_Rea_MODIS-NDVI_2010-297.rar
|
174,543.72
|
|
SEA_Rea_MODIS-NDVI_2010-121.rar
|
176,668.54
|
SEA_Rea_MODIS-NDVI_2010-305.rar
|
175,081.09
|
|
SEA_Rea_MODIS-NDVI_2010-129.rar
|
176,672.63
|
SEA_Rea_MODIS-NDVI_2010-313.rar
|
175,607.18
|
|
SEA_Rea_MODIS-NDVI_2010-137.rar
|
176,617.79
|
SEA_Rea_MODIS-NDVI_2010-321.rar
|
175,824.29
|
|
SEA_Rea_MODIS-NDVI_2010-145.rar
|
176,758.38
|
SEA_Rea_MODIS-NDVI_2010-329.rar
|
176,116.84
|
|
SEA_Rea_MODIS-NDVI_2010-153.rar
|
178,245.56
|
SEA_Rea_MODIS-NDVI_2010-337.rar
|
176,065.76
|
(To be continued on the next page)
|
(Continued)
|
|
|
|
Data file title
|
Data size (KB)
|
Data file title
|
Data size (KB)
|
|
|
SEA_Rea_MODIS-NDVI_2010-161.rar
|
179,343.16
|
SEA_Rea_MODIS-NDVI_2010-345.rar
|
175,925.25
|
|
|
SEA_Rea_MODIS-NDVI_2010-169.rar
|
179,752.97
|
SEA_Rea_MODIS-NDVI_2010-353.rar
|
176,782.02
|
|
|
SEA_Rea_MODIS-NDVI_2010-177.rar
|
179,495.96
|
SEA_Rea_MODIS-NDVI_2010-361.rar
|
176,590.19
|
| |
|
|
|
|
|
4.2 The Increase of Higher Quality Data
A comparison for evaluating the effectiveness of reconstruction was illustrated in Table 4. “Percent of Changed Pixels” can be used as a proxy for data quality improvement, given the fact that data with good quality had been kept in advance. For this subset of data, we concluded that more than 27% of the pixels with low quality had been improved with various extents.
Table 4 Statistics of changed MODIS-NDVI pixels for selected composite periods
|
Composite period
|
Date
|
No. of
all pixels
|
No. of
no-change pixels
|
Percent of no-changed Pixels
|
Percent of changed pixels
|
|
DOY001
|
1-8, Jan.
|
441,316,080
|
321,891,754
|
72.94
|
27.06
|
|
DOY033
|
2-9, Feb.
|
441,316,080
|
321,821,304
|
72.92
|
27.08
|
|
DOY065
|
6-13, March
|
441,316,080
|
321,906,903
|
72.94
|
27.06
|
|
DOY097
|
7-14, April
|
441,316,080
|
321,928,179
|
72.95
|
27.05
|
|
DOY121
|
1-8, May
|
441,316,080
|
321,846,869
|
72.93
|
27.07
|
|
DOY153
|
2-9, June
|
441,316,080
|
321,602,839
|
72.87
|
27.13
|
4.3 Enhancement of Temporal Series Continuity
Time series continuity was a good indicator for high quality NDVI time serial, because vegetations in natural condition usually change smoothly, abrupt change like “spike” or “sharp valley” is rarely expected. Figure 4 presented two examples: double season vegetation and evergreen tree, many pixels contaminated by noises had been restored.
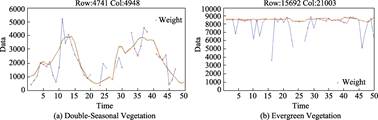
Figure 4 Effect of filtering on temporal smoothness
4.4 Enhancement of Spatial Continuity
Spatial continuity was another good indicator for high quality NDVI time serial. Figure 5 showed the improvement of spatial continuity for composite period DOY153 (2-9, June, 2010). Figure 5(a) showed many very low NDVI values over the Southeast Asia, it was obviously not correct because nearly half of this region was covered with good forest and still others were bushes and crops. Comparatively, the reconstructed NDVI in Figure 5(b) gave a more reliable picture for land cover in Southeast Asia, especially in northern part.
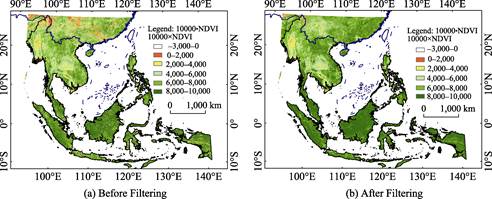
Figure 5 Effect of filtering on MODIS-NDVI (DOY153)
5 Conclusion
The standard 16-day MODIS-NDVI time serial from both Terra and Aqua were gravely contaminated by frequent cloud residuals, and discredited its application if they were directly used. The reanalyzed dataset in this paper has largely removed the noises by taking full use of Quality Assurance (QA) and Day of the Year (DOY) information in pixel level. The preliminary validation demonstrated its improvement in terms of temporal and spatial
continuums.
Author contributions
Wang, Z. X. was responsible for developing methodology, data quality control, and paper writing. Cao, Y. F. was in charge of programming, data analysis, and data validation.
Acknowledgments
The authors would like to acknowledge the support by “Joint Retrieval of Essential Variables in Biospherical Carbon Cycle from Multiple Satellite Data (2016YFA0600201)”,
Ministry of Science and Technology of P. R. China.
References
[1] Wang, Z. X., Cao, Y. F. Reanalysis dataset of MODIS-NDVI in Southeast Asia, 2010[DB/OL]. Global Change Research Data Publishing & Repository, 2016. DOI: 10.3974/geodb.2016.03.16.V1.
[2] GCdataPR Editorial Office. GCdataPR Data Sharing Policy [OL]. DOI:10.3974/dp.policy.2014.05 (Updated 2017).
[3] Didan, K., Huete, A. MODIS vegetation index product series collection 5 change summary [Z/OL]. http://www.ctahr.hawaii.edu/grem/mod13ug/index.html. TBRS Lab., the University of Arizona, 2006-06-29.
[4] Jönsson, P., Eklundh, L. TIMESAT—a program for analyzing time series of satellite sensor data [J]. Computers and Geo-science, 2004, 30 (8): 833-845.
[5] Cao, Y. F., Wang, Z. X., Deng, F. P. Fidelity performance of three filters for high quality NDVI time-series analysis [J]. Remote Sensing Technology & Application, 2010, 25(1): 118-125.
[6] Wang, Z. X., Ke, L. H., Deng, F. P. Doubling MODIS-NDVI temporal resolution: From 16-day to 8-day [J]. Remote Sensing Technology & Application, 2011, 26(4): 437-443.
[7] Wang, Z. X., Wang, Y. Q. Study on decoding MODIS QA using LDOPE Tools [J]. Remote Sensing
Technology & Application, 2013, 28(3): 459-466.