Global Soil Moisture Retrievals Fusion Dataset (2015?C2019)
Wang, Z. Y.1 Liu, Y. X. Y.2,3,*
1. School of Civil and Surveying & Mapping Engineering,
Jiangxi University of Science and Technology, Ganzhou 341000, China;
2. Guangzhou Institute of Geography, Guangdong Academy of
Sciences, Guangzhou 501170, China;
3. Southern Marine Science and Engineering Guangdong
Laboratory (Guangzhou), Guangzhou 511458, China
Abstract: In order to improve
the spatial-temporal data quality of satellite based global soil moisture
retrievals, the authors developed the Global Soil Moisture Retrievals Fusion
Dataset (2015?C2019) based on multi-source satellite fusion products and using
the Soil Moisture Active Passive retrievals to interpolate the spatio-temporal
series of the ECV data, and then reprojected, resampled, and weighted the
calculation to produce a Global Soil Moisture Retrievals Fusion Dataset (Global
SM). The dataset was validated by comparing the values with ground observations
from 134 monitoring stations across eight soil moisture networks in Europe. The
data quality was improved by approximately 20%. The dataset is 6.71 GB and consists
of 1,737 files; it is archived in .tif format in 1,737 data files with the data
size of 6.71 GB.
Keywords: soil moisture; global
scale; daily data; 2015?C2019
Dataset Availability Statement:
The
dataset supporting this paper was published and is accessible through the Digital Journal of Global Change Data Repository at:
https://doi.org/10.3974/geodb.2020.08.03.V1.
1 Introduction
Soil
moisture??the volume of liquid water contained in a unit volume of soil??is a key
physical quantity of global climate change, land surface hydrological
processes, and the carbon cycle[1?C4].
It affects vegetation growth by controlling the soil heat capacity, surface
evaporation, and vegetation transpiration[5?C7]. Therefore, obtaining accurate soil moisture data is
necessary for assessing terrestrial ecosystem successions as well as the
carbon, nitrogen, and water cycles; it can also provide early warnings of drought
and flood disasters and improve estimations of crop yield[8?C11].
Satellite remote
sensing technology can obtain continuous time-series data of land surface soil
moisture on the global scale. Massive satellite soil moisture retrievals provide
unprecedented opportunities for global climate evolution analysis[12?C13]; however, these datasets have large numbers of null
areas because of satellite gaps, radio frequency interference, vegetation
optical thickness, and freezing seasons[14?C16].
Different microwave bands (e.g., C-band, X-band, K-band, Ka-band, L-band) have
different sensitivities to surface soil moisture[17]. To improve the time-space sequence integrity and data
quality of satellite soil moisture retrievals, the European Space Agency
developed the Essential Climate Variable Soil Moisture product (ECV SM) by
fusing multi-source satellite remote sensing data of global surface soil
moisture since 2010[18?C20].
Compared with single-band satellite soil moisture retrievals, ECV SM has the
longest time series, and its spatial sequence integrity and data accuracy have
been significantly improved. However, the spatial coverage of this product is
relatively low compared with that of other assimilation retrievals.
Accordingly, integrating new satellite soil moisture retrievals can effectively
improve the spatial integrity and data quality of ECV SM. To improve the
integrity and accuracy of ECV SM retrieval data[21], we integrated ECV SM with the L-band Soil Moisture
Active Passive (SMAP) dataset from 2015 to 2019[22]. After reprojecting, resampling, and interpolating the
data, we produced the daily Global Soil Moisture Retrievals Fusion dataset
(Global SM)[23?C26]with a resolution of 0.25?? from March 31,
2015, to December 31, 2019.
2 Metadata of the Dataset
The
metadata summary of the dataset[27]
is summarized in Table 1, which includes the dataset full name, short name,
authors, year, temporal resolution, spatial resolution, data format, data size,
data files, publisher, and sharing policies, etc.
3 Methods
3.1 Data Sources
ECV
SM fuses multi-source active (ERS-1, ERS-2, MetOp-A, ASCAT) and passive microwave
retrievals (SMMR, SSM/I, TMI, AMSR-E, AMSR-2, Windsat, SMOS)[21] to form a global daily soil moisture dataset.
SMAP is a global daily soil moisture retrieval dataset from 2015 to 2019; it is
based on the L-band passive microwave radiometer inversion, with a spatial
resolution of 36 km ?? 36 km[22]. Many studies have shown that the sensitivity
of the L-band to surface soil moisture is better than that of other microwave
bands, and its ground penetration depth is closest to the depth of the soil
moisture ground monitoring sensor. NASA has improved the SMAP satellite sensor
and its inversion algorithm to enhance its anti-jamming capability of ground
man-made radio frequency interference. The verification inferred a higher
accuracy and stronger spatio-temporal adaptability of SMAP SM retrievals
relative to that of the other satellite soil moisture retrievals in ECV[23, 29?C31].
We verified and evaluated the ECV SM and
ascending and descending SMAP SM observations by comparing the data with
ground-based measurements from 134 monitoring stations across eight soil
moisture measurement networks in Europe. The data of the eight European in-situ networks applied in this study
were acquired from the International Soil Moisture Network[32]. The basic attributes of each in-situ measurement are listed in Table
2.
Table 1 Metadata summary of the ??Reprocessing
dataset of global soil moisture product (2015?C2019)??
|
Items
|
Description
|
|
Dataset full name
|
Reprocessing
dataset of global soil moisture product (2015?C2019)
|
|
Dataset
short name
|
Global_SM
|
|
Authors
|
Liu, Y. X. Y. ABB-3889-2020, Guangzhou Institute of Geography, Guangdong Academy of Sciences,
lyxy@lreis.ac.cn
|
|
Geographical
region
|
Global:
90 ??S?C90 ??N, 180 ??W?C180 ??E
|
|
Year
|
2015?C2019
|
|
Temporal
resolution
|
Daily
|
|
Spatial
resolution
|
0.25??
??0.25??
|
|
Data
format
|
.tif
|
|
Data
size
|
6.71 GB
|
|
Data
files
|
This dataset includes 1,737
files. The dataset consists of daily data files from March 31, 2015 to
December 31, 2019, named in the form of SM-yyyymmdd.tif. For example,
SM-20160101.tif is the global soil moisture fusion data on January 1, 2016
|
|
Foundations
|
National Postdoctoral Program
for Innovative Talents of China (BX20200100); National Earth Observation Data
Center of China (NODAOP2020002); Key Special Project for Introduced Talents Team
of Southern Marine Science and Engineering Guangdong Laboratory (GML2019ZD0301)
|
|
Data
publisher
|
Global Change Research Data Publishing &
Repository, http://www.geodoi.ac.cn
|
|
Address
|
No.
11A, Datun Road, Chaoyang District, Beijing 100101, China
|
|
Data
sharing policy
|
Data from the Global Change
Research Data Publishing &Repository includes metadata, datasets (in the Digital Journal of Global Change Data Repository), and
publications (in the Journal of Global Change Data & Discovery). Data
sharing policy includes: (1) Data are openly available
and can be free downloaded via the Internet; (2) End users are encouraged to
use Data subject to citation; (3) Users, who are by definition
also value-added service providers, are welcome to redistribute Data subject
to written permission from the GCdataPR Editorial Office and the issuance of
a Data redistribution license; and (4) If Data are
used to compile new datasets, the ??ten per cent principal?? should be followed
such that Data records utilized should not surpass 10% of the
new dataset contents, while sources should be clearly noted in suitable
places in the new dataset[28]
|
|
Communication
and searchable system
|
DOI, DCI, CSCD, WDS/ISC, GEOSS, China
GEOSS, Crossref
|
Table 2 Information of the eight
European in-situ measurement networks
|
Name
|
Nation
|
Number
of Stations
|
Regional
Climate
|
Land
Cover Types
|
|
REMEDHUS
|
Spain
|
20
|
Temperate marine climate
|
Cropland and shrubland
|
|
FR_Aqui
|
France
|
4
|
Mediterranean climate
|
Cropland and forest
|
|
FMI
|
Sweden
|
20
|
Climate of sub-frigid coniferous
forest
|
Woody savanna
|
|
HOBE
|
Denmark
|
27
|
Temperate marine climate
|
Cropland and forest
|
|
BIEBRZA_S
|
Poland
|
18
|
Temperate continental climate
|
Grassland and marshland
|
|
TERENO
|
Germany
|
5
|
Temperate marine climate
|
Cropland and forest
|
|
RMSN
|
Romania
|
19
|
Temperate continental climate
|
Cropland and forest
|
|
SMOSMANIA
|
France
|
21
|
Mediterranean climate
|
Diverse land cover
|
3.2 Data Processing
This study aimed to improve
the integrity and accuracy of ECV SM retrieval data. To evaluate the quality of
SMAP and ECV SM retrievals, we compared the data with the in-situ observations. Moreover, to ensure the quality and stability
of the ground measurements, only ground records covering > 12 hr in one day
were considered valid, and the daily in-situ
soil moisture was calculated as the
arithmetic averages of all sites in every network. In this study, the
correlation coefficient (R), bias,
and unbiased root mean square error (ubRMSE) were the error parameters used to
verify the accuracy of the ECV and SMAP data. Our results suggest that SMAP is a high-quality data source for ECV
interpolation due to its higher accuracy. Secondly, to enhance the data
coverage percentage, we obtained daily SMAP soil moisture data by calculating the arithmetic averages of the ascending
and descending SMAP observations.
Moreover, we conducted projection transformation and spatial resampling to
enhance the spatial consistency of the ECV SM and SMAP SM datasets. Thirdly, we
used Python to read and traverse the ECV daily data to identify the null
areas. Finally, we used the SMAP daily SM retrieval consistent with ECV spatial
properties to interpolate the ECV SM data and produce the Global SM dataset.
Finally, this study evaluated and verified the spatial integrity and accuracy
of the Global SM data. The data development process is shown in Figure 1.
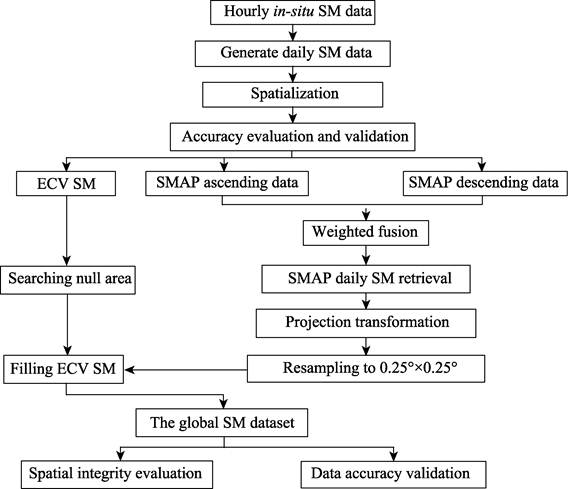
Figure 1 Flowchart of the soil
moisture retrieval fusional algorithm
4 Data Results and Validation
4.1 Data Composition
The
global soil moisture retrievals fusion dataset (2015?C2019) includes a total of
1,737 files and consists of daily global coverage data files from March 31,
2015, to December 31, 2019 (named in the form of SM-yyyymmdd.tif). The dataset
has a spatial resolution of 0.25?? ?? 0.25?? (approximately 25 km ?? 25 km). The
soil moisture unit in the dataset is m3žm?C3, and its value range is [0,1].
4.2 Data Results
Figure 2
compares the ECV SM with the global soil moisture retrievals fusion dataset
(2015?C2019) for January 1, April 1, July 1, and October 1, 2016. The soil
moisture temporal and spatial distribution characteristics were highly
consistent with the regional seasonal cycle and ranged from 0 to 0.5 m3žm?C3. The dataset was significant improved in its
spatial coverage. In winter and spring, the surface temperature was constantly
below 0 ??C, with
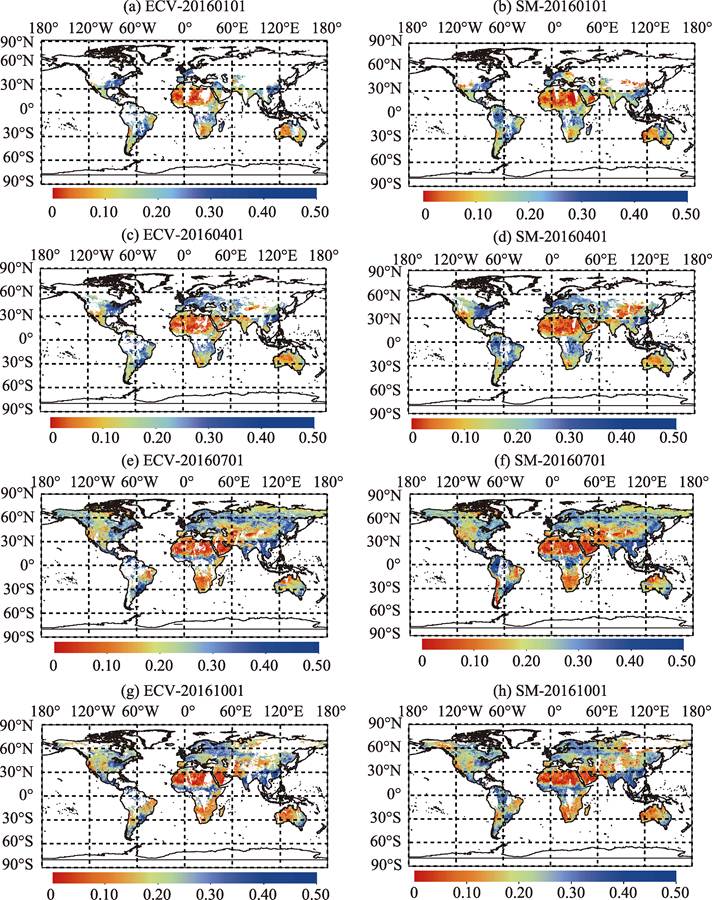
Figure 2 Comparison Maps of ECV SM data (January
(a), April (c), July (e), and October (g)) with the Global SM results (January
(b), April (d), July (f), and October (h)) (Unit: m3žm?C3)
frozen soil in the high latitude regions. Greenland and
Antarctica were covered with snow and ice throughout the year; however, the
soil moisture value in those area was absent, as microwaves can only measure
the content of liquid water in soil.
4.3 Data Validation
4.3.1 Integrity Assessment
Figure 3 compares the
spatial coverage of the original ECV SM and the Global SM datasets. After data
fusion, the spatial coverage of the Global SM improved by approximately 20%
compared with the original ECV SM. Moreover, the Global SM filled the ECV SM
null values in the Amazon rainforest and the Congo Basin rainforest. The Global
SM therefore effectively analyzes the continuity of soil moisture on both temporal
and spatial scales. Furthermore, we observed high soil moisture coverage in the
middle and low altitudes (at approximately 60??S?C60??N) and in areas of low
vegetation coverage, as microwaves cannot effectively penetrate ice and vegetation
(> 5 kgžm?C2).
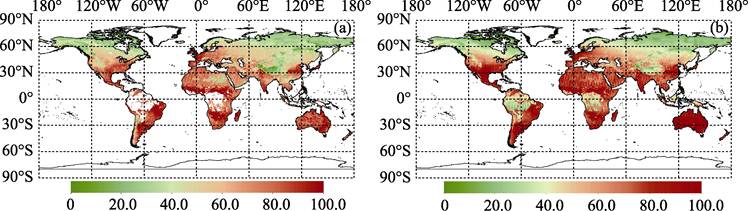
Figure 3 Spatial coverage of ECV
SM (a) and Global SM (b) data (Unit: %)
4.3.2 Accuracy
Evaluation
We verified and evaluated the ECV SM and
ascending and descending SMAP SM observations by comparing the data with
measurements from 134 ground-based monitoring stations across the eight
European soil moisture networks (Figures 4?C6). The horizontal lines in the boxplots
represent the maximum, upper four quantile, median, lower four quantile, and
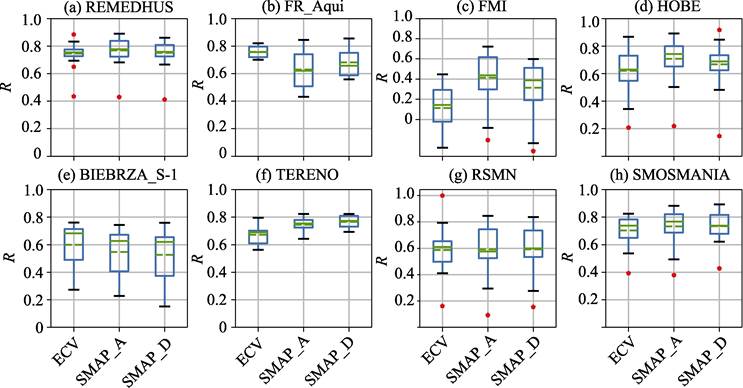
Figure 4 Boxplots of correlation
coefficients for ECV SM and SMAP SM retrievals
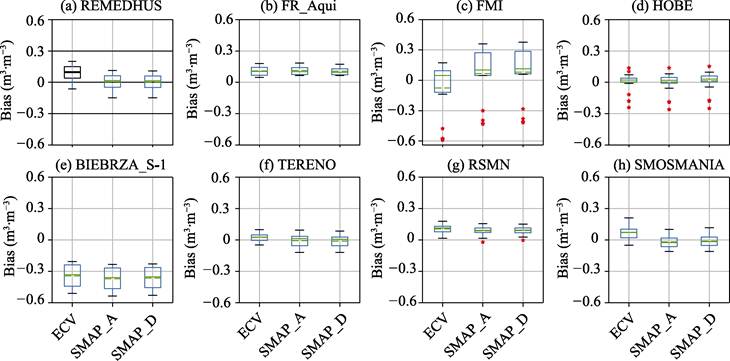
Figure 5 Boxplots of bias for ECV SM and
SMAP SM retrievals
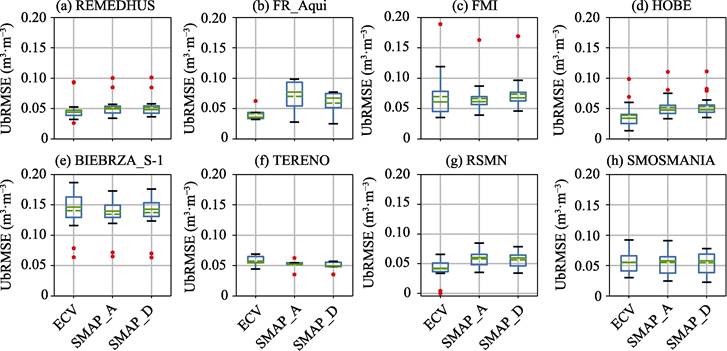
Figure 6 Boxplots of RMSE for
ECV SM and SMAP SM retrievals
minimum values. The dotted line represents the average of an
array, and the red points represent the outliers. The correlation coefficient
and bias of SMAP were stronger than those of ECV SM, while the ubRMSE of SMAP
was equivalent to that of ECV[33].
This suggests that the SMAP SM retrievals are reliable, of high quality, and
can effectively improve the integrity of the ECV SM data[34].
We
used in-situ data to verify the
accuracy of the Global SM, and the results are shown in Table 3. The accuracy
of the Global SM was equivalent to that of ECV SM, but the Global SM performed
better in the REMEDHUS, FR_Aqui, RSMN, and SMOSMANIA networks. The Global SM
can therefore effectively capture the amplitude and temporal variations of soil
moisture and accurately fit the in-situ
measurements. Overall, the Global SM can precisely reflect the distribution and
variability of in-situ measurements.
To
further analyze the correlation between the Global SM and in-situ data distributions, the curve of the probability
distribution function (PDF) of the in-situ,
original ECV SM, and Global SM datasets is shown in Figure 7. The three soil
moisture datasets showed a normal distribution, but the ECV SM distribution
(red line) was notably clustered and the curve of PDF of the Global SM was more
closed to it of the in-situ data.
Table 3 Evaluation results of the
Global SM data
|
In-situ Measurements
|
R
|
Bias
|
ubRMSE
|
R
|
Bias
|
ubRMSE
|
|
REMEDHUS
|
0.75
|
0.09
|
0.05
|
0.77
|
0.08
|
0.04
|
|
FR_Aqui
|
0.76
|
0.11
|
0.04
|
0.77
|
0.11
|
0.04
|
|
FMI
|
0.11
|
‒0.08
|
0.07
|
‒0.04
|
0.00
|
0.06
|
|
BIEBRZA_S-1
|
0.60
|
‒0.34
|
0.14
|
0.58
|
‒0.35
|
0.13
|
|
TERENO
|
0.67
|
0.02
|
0.06
|
0.57
|
0.02
|
0.06
|
|
RSMN
|
0.56
|
0.11
|
0.05
|
0.58
|
0.10
|
0.05
|
|
SMOSMANIA
|
0.62
|
0.08
|
0.10
|
0.68
|
0.07
|
0.06
|
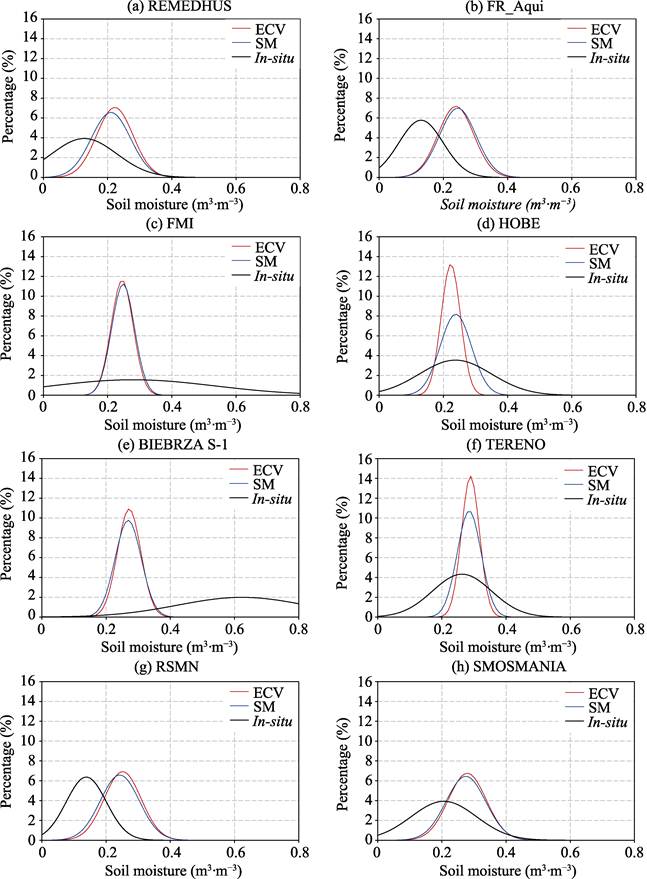
Figure 7 Soil
moisture PDF curves of ECV SM data, Global SM data, and in-situ measurements
5 Discussion and Conclusion
Using SMAP SM retrievals to fill in null ECV SM data
points, we produced a daily global soil moisture dataset with a resolution of
0.25?? ?? 0.25?? from March 31, 2015, to December 31, 2019. To ensure data
quality, we verified the ECV SM, ascending and descending SMAP SM, and the Global_SM
datasets by comparing their values with 134 in-situ
measurements across eight European ground-based networks. We found that the
Global_SM dataset showed equivalent values and evolutionary spatio-temporal
tendencies to that of the in-situ
measurements. Moreover, the accuracy and spatial coverage integrity of the
Global_SM dataset were significantly improved.
We
assumed that the in-situ data
represented the ??ideal true value??, but its spatial resolution varied from the
raster pixels with a resolution of 0.25?? ?? 0.25????especially in underlying
surfaces with complex properties. Therefore, the validation results based on
the in-situ data can to some extent
prove the quality of the Global_SM dataset but are not entirely equivalent to
the dataset??s accuracy.
Satellite
soil moisture retrievals commonly have null areas. However, our study demonstrates
that the use of high-precision SMAP retrievals to interpolate the null areas of
the ECV SM data is an effective method for producing a global soil moisture
dataset with high spatial coverage. We suggest that future research attempt to
retrieve soil moisture data by mapping the relationship between soil moisture
and multi-source surface parameters (such as precipitation, temperature,
vegetation index) based on mathematical models.
Author
Contributions
Liu, Y. X. Y. designed the
dataset algorithms. Wang, Z. Y. contributed to the data processing and analysis
and also drafted the manuscript.
References
[1]
Mei, S. Y.,
Walker, J. P., R??diger, C., et al. A
comparison of SMOS and AMSR2 soil moisture using representative sites of the
OzNet monitoring network [J]. Remote
Sensing of Environment, 2017, 195: 297‒312.
[2]
Tang, R.,
Li, Z. L., Tang, B. An application of the Ts?CVI triangle method with enhanced
edges determination for evapotranspiration estimation from MODIS data in arid
and semi-arid regions: implementation and validation [J]. Remote Sensing of Environment, 2010, 114(3): 540‒551.
[3]
Liu, Y.,
Yao, L., Jing, W., et al. Comparison
of two satellite-based soil moisture reconstruction algorithms: a case study in
the state of Oklahoma, USA [J]. Journal
of Hydrology, 2020, 10(2): 1‒18.
[4]
Liu, Y.,
Jing, W., Wang, Q., et al. Generating
high-resolution daily soil moisture by using spatial downscaling techniques: a
comparison of six machine learning algorithms [J]. Advances in Water Resources, 2020, 141: 103601.
[5]
Dong, J.,
Crow, W. T., Tobin, K. J., et al.
Comparison of microwave remote sensing and land surface modeling for surface
soil moisture climatology estimation [J]. Remote
Sensing of Environment, 2020, 242: 111756.
[6]
Rigden, A.,
Mueller, N., Holbrook, N., et al.
Combined influence of soil moisture and atmospheric evaporative demand is
important for accurately predicting US maize yields [J]. Nature Food, 2020, 1(2): 127‒133.
[7]
Bing, L., Su,
H., Shao, Q., et al. Changing Characteristic
of Land Surface Evapotranspiration and Soil
Moisture in China during the Past 30 Years [J]. Journal of Geo-Information Science, 2012,
14(1): 1‒13.
[8]
Lakshmi,
V., Piechota, T., Narayan, U., et al.
Soil moisture as an indicator of weather extremes [J]. Geophysical Research Letters, 2004, 31(11): 1‒4.
[9]
Liu, J.,
Shi, C., Sun, S., et al. Improving
land surface hydrological simulations in China using CLDAS meteorological
forcing data [J]. Journal of
Meteorological Research, 2019, 33(6): 1194‒1206.
[10]
Qin, J.,
Yang, K., Lu, N., et al. Spatial
upscaling of in-situ soil moisture
measurements based on MODIS-derived apparent thermal inertia [J]. Remote Sensing of Environment, 2013, 138:
1‒9.
[11]
Liu, S., Xing,
B., Yuan, G., et al. Relationship
analysis between soil moisture in root zone and top-most layer in China [J]. Chinese
Journal of Plant Ecology, 2013, 37(1): 1‒17.
[12]
Dorigo, W.,
Wagner, W., Albergel, C., et al. ESA
CCI soil moisture for improved earth system understanding: state-of-the art and
future directions [J]. Remote Sensing of
Environment, 2017, 203: 185‒215.
[13]
Liu, Y.,
Yang, Y., Jing, W., et al. Comparison
of different machine learning approaches for monthly satellite-based soil
moisture downscaling over northeast China [J]. Remote Sensing, 2018, 10(1): 31.
[14]
Draper, D. W.
Radio frequency environment for earth-observing passive microwave imagers [J]. IEEE Journal of Selected Topics in Applied
Earth Observations & Remote
Sensing, 2018, 11(6): 1913‒1922.
[15]
Piepmeier,
J. R., Johnson, J. T., Mohammed, P. N., et
al. Radio-Frequency interference mitigation for the Soil Moisture Active
Passive Microwave Radiometer [J]. IEEE
Transactions on Geoscience &
Remote Sensing, 2014, 52(1): 761‒775.
[16]
Zou, X.,
Zhao, J., Weng, F., et
al. Detection of radio-frequency interference signal over land from
FY-3B microwave radiation imager (MWRI) [J]. Advances in Meteorological Science & Technology, 2013, 50(12): 4994‒5003.
[17]
Sabaghy,
S., Walker, J. P., Renzullo, L. J., et al.
Spatially enhanced passive microwave derived soil moisture:
capabilities and opportunities [J]. Remote
Sensing of Environment, 2018, 209: 551‒580.
[18]
Hollmann,
R., Merchant, C. J., Saunders, R., et al.
The ESA climate change initiative: satellite data records for essential climate
variables [J]. Bulletin of the American
Meteorological Society, 2013, 94(10): 1541‒1552.
[19]
Dorigo, W. A.,
Gruber, A., Jeu, R. A. M. D., et al.
Evaluation of the ESA CCI soil moisture product using ground-based observations
[J]. Remote Sensing of Environment,
2015, 162(2): 380‒395.
[20]
Chakravorty,
A., Chahar, B. R., Sharma, O. P., et al.
A regional scale performance evaluation of SMOS and ESA-CCI soil moisture
products over India with simulated soil moisture from MERRA-Land [J]. Remote Sensing of Environment, 2016, 186:
514‒527.
[21]
ESA CCI Soil Moisture
[DB/OL]. https://www.esa-soilmoisture-cci.org/.
[22]
SMAP Data
[DB/OL]. https://nsidc.org/data/smap/smap-data.html.
[23]
Spencer,
M., Wheeler, K., White, C., et al.
The Soil Moisture Active Passive (SMAP) mission L-Band radar/radiometer
instrument [A]. Geoscience and Remote Sensing Symposium, 2010 IEEE
International, 2010: 3240?C3243.
[24]
O??Neill, P., Entekhabi, D., Njoku, E., et al. The NASA Soil
Moisture Active Passive (SMAP) mission: Overview [A]. Geoscience and Remote Sensing Symposium (IGARSS), 2010 IEEE
International, 2010: 1210‒1223.
[25]
Ma, H.,
Zeng, J., Chen, N., et al. Satellite
surface soil moisture from SMAP, SMOS, AMSR2 and ESA CCI: a comprehensive
assessment using global ground-based observations [J]. Remote Sensing of Environment, 2019, 231: 111215.
[26]
Liu, Y.,
Yang, Y., Jing, W. Potential applicability of SMAP in ECV soil moisture
gap-filling: a case study in Europe [J]. IEEE
Access, 2020, 8(133): 114‒127.
[27]
Liu, Y. X.
Y. Global soil moisture retrievals fusion dataset (2015?C2019) [J/DB/OL]. Digital Journal of Global Change Data Repository,
2020. https://doi.org/10.3974/geodb.2020.08.03.V1.
[28]
GCdataPR
Editorial Office. GCdataPR data sharing policy [OL]. https://doi.org/10.3974/dp.policy.2014.05 (Updated 2017).
[29]
Stillman,
S., Zeng, X. Evaluation of SMAP soil moisture relative to five other satellite
products using the climate reference network measurements over USA [J]. IEEE Transactions on Geoscience & Remote Sensing, 2018, 99: 1‒10.
[30]
Chen, F.,
Crow, W. T., Bindlish, R., et al.
Global-scale evaluation of SMAP, SMOS and ASCAT soil moisture products using
triple collocation [J]. Remote Sensing of
Environment, 2018, 214: 1‒13.
[31]
Zhang, X.,
Zhang, T., Zhou, P., et al.
Validation analysis of SMAP and AMSR2 soil moisture products over the United
States using ground-based measurements[J]. Remote
Sensing, 2017, 9(2): 104.
[32]
International
Soil Moisture Network. https://ismn.geo.tuwien.ac.at/en/.
[33]
Cui, C.,
Xu, J., Zeng, J., et al. Soil moisture
mapping from satellites: an intercomparison of SMAP, SMOS, FY3B, AMSR2, and ESA
CCI over two dense network regions at different spatial scales [J]. Remote Sensing, 2017, 10(2): 33.
[34]
Burgin, M. S.,
Colliander, A., Njoku, E. G., et al.
A comparative study of the SMAP passive soil moisture product with existing
satellite-based soil moisture products [J]. IEEE
Transactions on Geoscience & Remote
Sensing, 2017, 55(5): 2959‒2971.